[View Larger Version of this Image]
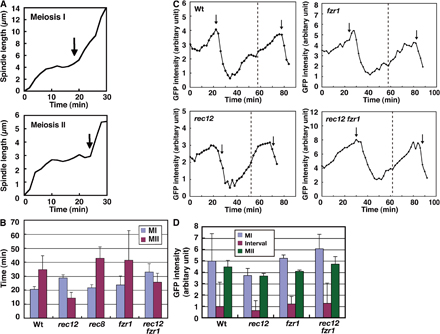
Figure S1. Cdc13-GFP dynamics in meiotic progression. (A) Timing of Cdc13 disappearance from the spindle in relation to spindle dynamics. Graphs show changes of MI (top) and MII (bottom) spindles and the disappearance of Cdc13-GFP from the spindle (arrows). Cdc13 disappeared from the spindle just before anaphase spindle elongation. (B) Duration of Cdc13 localization at the spindle. At least seven spindles were examined for each analysis. Although expression of Cdc13-GFP alone frequently delayed anaphase II onset due perhaps to inefficient degradation of Cdc13-GFP, impacts of various mutations on timing of anaphase onset were basically identical to those observed in cells with no Cdc13-GFP expression. (C) Changes in the amount of Cdc13-GFP. Graphs show changes in intensities of nuclear GFP signal. Time 0 is the start of MI spindle formation. The start of MII spindle formation is shown by the broken lines. Arrows indicate disappearance of Cdc13-GFP from the spindle. (D) Fluorescence intensities of Cdc13-GFP at different stages. Maximum intensities at MI and MII and minimum intensities after anaphase I (Interval) are shown. At least five cells were examined for each strain. The GFP intensities were slightly lower in the rec12 mutant than in the wild type, whereas it was slightly higher in the rec12 fzr1 mutant. However, because of the lack of the internal control, we could not determine if the difference among the strains was significant. Error bars indicate standard deviation.