Blood, Vol. 112, Issue 7, 2858-2868, October 1, 2008
FoxP3+CD4+ regulatory T cells play an important role in acute HIV-1 infection in humanized Rag2–/– C–/– mice in vivo
Blood Jiang et al. 112: 2858
Supplemental materials for: Jiang et al
Files in this Data Supplement:
- Figure S1. Antibodies, isotype controls and gating strategy for multi-color FACS analysis (JPG, 120 KB) -
(A) Live human (VLD−, murine CD45−, human CD45+) cells in PBMC, mesenteric lymph node (mLN), spleen, peripheral lymph node (PLN) and thymus were analyzed by multi-color FACS for expression of CD25 and FoxP3 on CD3+CD4+CD8−human T cells. Isotype control antibodies with appropriate labels were used for background staining. (B) Expressions of FoxP3 and CD25 on CD3+CD4+CD8− T cells were analyzed with human cells from various lymphoid organs of DKO-hu mice. Numbers indicate percentages of each subset. Shown are representative data from at least three independent experiments.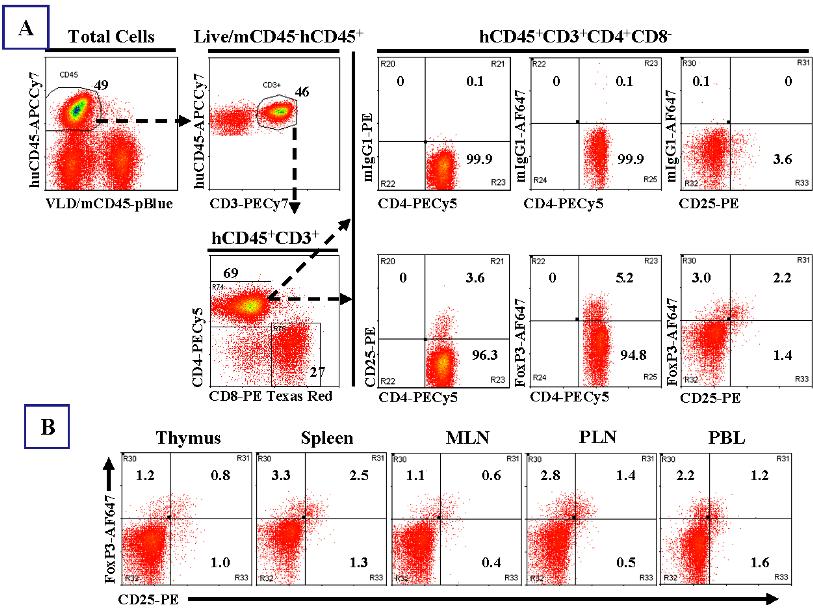
- Figure S2. The expression profile of human leukocyte markers on Treg cells (JPG, 70.2 KB) -
FoxP3+ or FoxP3− T cells from spleen (Spl, A) and mesenteric lymph node (mLN, B) of DKO-hu HSC mice were analyzed. Cells shown were gated on human CD45+ mouse CD45−VLD−human CD3+CD4+CD8− cells. Shown are representative data from at least three independent experiments.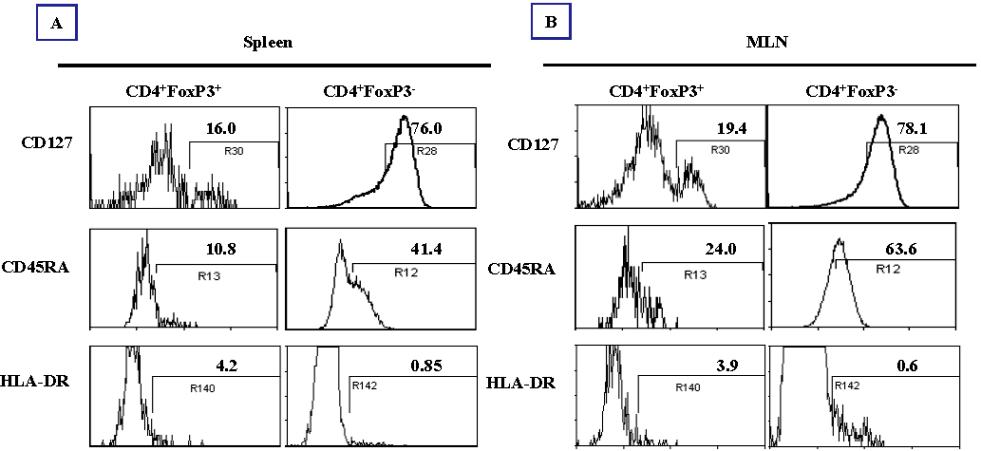
- Figure S3. Depletion of Treg by ONTAK in DKO-hu HSC mice (JPG, 97.4 KB) -
As performed in human patients, ONTAK (Denileukin diftitox) in saline was injected iv at 5 mg/kg/day over 2–3 days (10 DKO-hu HSC mice treated with ONTAK or PBS). (A) Human CD45+, CD3+CD4+CD8− T cells in PBMC were analyzed by multi-color FACS before injection (day 0) or 3 and 6 days after injection (post-ONTAK). Relative % CD4+CD25+/hi cells are shown as % relative to pretreatment. ONTAK treatment significantly reduced % CD4+CD25+ T cells (p+CD3+ T cells from spleen were analyzed for CD4/CD8 and CD25/FoxP3 expression. Spleen CD45+CD3+ T cells were also stained for T cell activation marker HLA-DR, relative activation of CD4 and CD8 T cells (% HLA-DR+) is shown.