[View Larger Version of this Image]
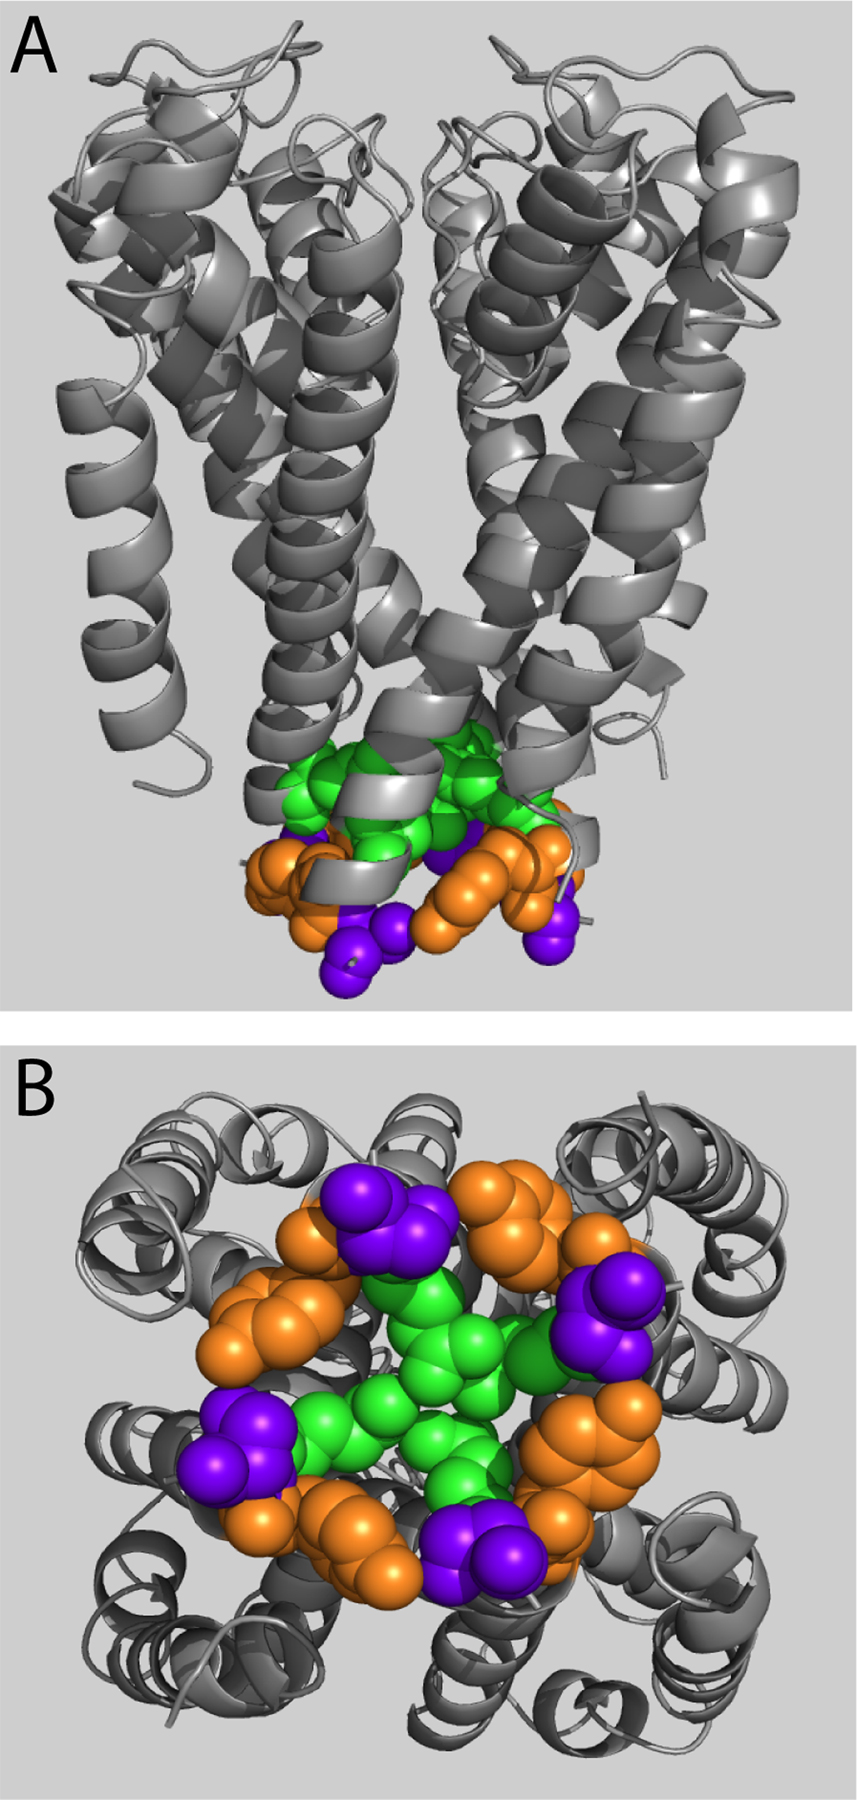
Figure S1. KcsA-based model views of constitutively conducting S6 mutant locations. (A and B) Closed-state homology modeling of the native side chains constitutively conducting mutants reveals a domain of clustered amino acid side chains. Backbone α-helix trace of S5 through S6 domain is represented as gray ribbon; native side chains of affected residues are represented as space-filled spheres, with Q664 in green, Y667 in orange, and S668 in purple. Models from a cross-sectional membrane view (A) and bottom up through the vestibule (B) show the affected residues in the open state in individual subunit domains.