[View Larger Version of this Image]
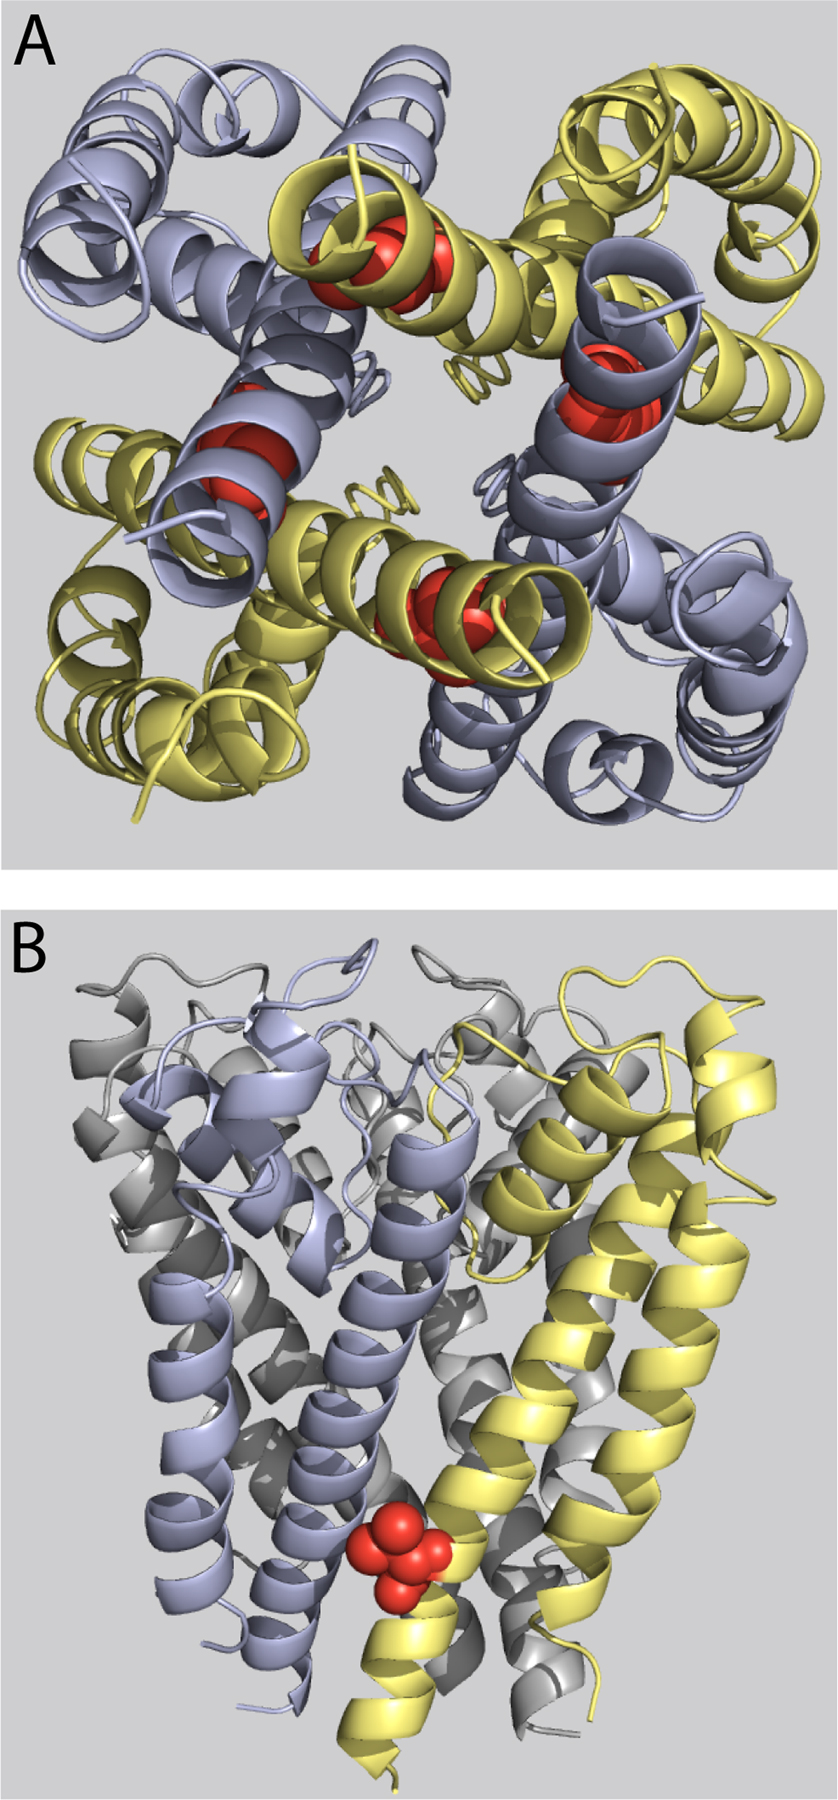
Figure S2. KcsA-based homology modeling of native V659 side chain orientation. (A and B) The native V659 side chain is represented as red space-filled spheres, and the backbone α-helix of S5 through S6 domains is represented as either light blue or light yellow ribbon. (A) View from the cytoplasm up through the vestibule of the open-state homology model, illustrating V659 at the intersection of adjacent S6 domains and near the bundle crossing. The native side chain does not face the pore in the open state. (B) Cross-sectional membrane view, showing V659 side chain in a similar orientation as modeled in the MlotiK1-based model.