Blood, Vol. 112, Issue 9, 3688-3695, November 1, 2008
Maintenance of a normal thymic microenvironment and T-cell homeostasis require Smad4-mediated signaling in thymic epithelial cells
Blood Jeker et al. 112: 3688
Supplemental materials for: Jeker et al
Files in this Data Supplement:
- Figure S1. Viability of isolated TECs (JPG, 153 KB) -
(A) Total TECs from individual Smad4co/co and Smad4co/co;Foxn1Cre mice (n=3, aged 4–5 weeks) were isolated by sequential enzymatic digestion and all fractions obtained were pooled and stained both for CD45 and the epithelial marker EpCAM. Propidium iodide (PI) was added before analysis to identify dead cells. FSC/SSC profiles were used to set the live gate (i) and CD45/EpCAM dotplots gated on live cells are shown to delineate TECs (ii). EpCAM/PI dotplots are shown from gated TECs within the live gate (iii). To rule out that TECs from either strain of mice are preferentially susceptible to cell death, CD45/EpCAM dotplots are displayed from all collected, ungated events (iv) and EpCAM/PI dotplots are shown from gated TECs without live gating (v). Frequencies of the respective populations are represented as means ± SD, * P co/co n=3, Smad4co/co;Foxn1Cre n=6, aged 1–2 weeks) were analysed in a fashion identical to that in part (A) of the figure.
- Figure S2. Effects of Inactivation of Smad4 in TECs in the fetal thymus (JPG, 62 KB) -
(A) Smad4 exon 9 deletion was verified in E16 sorted TEC populations. Rectangles in the dot plots indicate sorting gates. Deletion was quantified by genomic PCR yielding a 3 kb WT fragment and a 0.5 kb recombined fragment. (B) Total thymus cellularity and absolute and relative TEC numbers of Smad4co/co and Smad4co/co;Foxn1Cre embryos at E14 and E18. (C) Relative numbers of different thymic subpopulations defined by CD44 and CD25 expression in the Lin- population for early DN1–DN4 stages in E14 embryos and CD4 and CD8 expression to assess DN and DP populations in E18 embryos. (D) absolute and relative ETP numbers in E18 thymi. (E) Relationship between TEC and ETP frequencies in E18 thymi from Smad4co/co and Smad4co/co;Foxn1Cre embryos. For all experiments, a minimum of 3 mice per group were analysed, values are expressed as means (white bars: Smad4co/co, black bars: Smad4co/co;Foxn1Cre) with SD, * P P P P
- Figure S3. ERTR7 and Aire expression in the thymic microenvironment of Smad4co/co;Foxn1Cre mice (JPG, 128 KB) -
Immunofluorescence analysis of thymi from 6 weeks (A–B) and 20 weeks old mice (C–E) with a Smad4co/co (A,D) or Smad4co/co;Foxn1Cre (B–C, E) genotype stained for cytokeratin 5 (red), cytokeratin 18 (green) and ERTR7 (blue) (A–C) or cytokeratin 5 (green), cytokeratin 18 (blue) and Aire (red) (D–E). Scale bars: 100 µm.
- Figure S4. Hematopoeitic precursors from Smad4co/co;Foxn1Cre mice develop a normally sized thymus in Smad4 sufficient hosts (JPG, 17.4 KB) -
Lethally irradiated (1000 rad) C57BL/6 Ly 5.1 mice were reconstituted with T-cell–depleted bone marrow from either Smad4co/co or Smad4co/co;Foxn1Cre mice and thymus cellularity was determined 8 weeks later. 7 mice per group were analysed, values are expressed as means with SD (white bars: Smad4co/co, black bars: Smad4co/co;Foxn1Cre).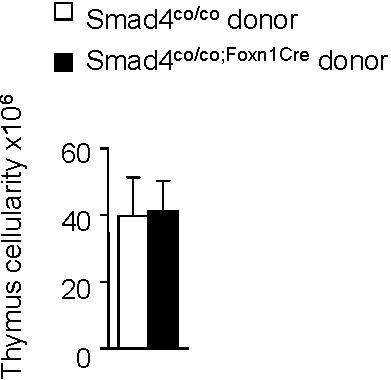
- Figure S5. The peripheral T-cell compartment in Smad4co/co;Foxn1Cre mice increases with time due to slow homeostatic proliferation (JPG, 65.4 KB) -
(A) Homeostatic expansion of either WT CFSE labelled T cells (upper row) or OT-I CFSE labelled T cells (lower row) in Smad4co/co and Smad4co/co;Foxn1Cre hosts 7 to 10 days after adoptive transfer. Boxed insert shows homeostatic proliferation of OT-I T cells in a Rag2−∕− host. (B) Frequency of memory phenotype (CD44hi) T cells in the spleen at different ages. For all experiments, a minimum of 3 mice per group were analysed, values are expressed as means (white bars: Smad4co/co, black bars: Smad4co/co;Foxn1Cre) with SD, * P P P P
- Figure S6. Comparable frequencies of hematopoietic precursors in bone marrow and blood from Smad4co/co and Smad4co/co;Foxn1Cre mice (JPG, 54.9 KB) -
(A) Frequency of Lin-Sca-1+c-kithi (LSK) cells and their CD62L expression in the bone marrow. 4–5 mice per group were analysed, values are expressed as means (white bars: Smad4co/co, black bars: Smad4co/co;Foxn1Cre) with SD. (B) Frequency of LSK cells and their CD62L expression in the blood. The blood from 4–5 mice of either Smad4co/co or Smad4co/co;Foxn1Cre genotype was pooled and stained. White bars: Smad4co/co, black bars: Smad4co/co;Foxn1Cre.