Blood, Vol. 112, Issue 10, 4069-4079, November 15, 2008
A molecular signaling model of platelet phosphoinositide and calcium regulation during homeostasis and P2Y1 activation
Blood Purvis et al. 112: 4069
Supplemental materials for: Purvis et al
Files in this Data Supplement:
- Figure S1. Modular calibration and feature extraction (JPG, 41.9 KB) -
(A) Example construction of a functional module, showing calibration of platelet Ca2+ balance. A fixed reaction network containing one or more unknown ICs (e.g., the concentration of a protein or the size of a compartment) was simulated to equilibrium using a large number of random value-sets. The output of each simulation was compared to experimentally measured values, and value-sets with low error (± 10% of experimental values) were selected as “points” in the module space. Principal components analysis (PCA) was then used to transform these points to a new coordinate set that maximally describes the variability in the module. (B) Simulated release of intracellular Ca2+ for sampled points along the first principal component. Traces show the first second of Ca2+ release after a ten-fold increase in IP3.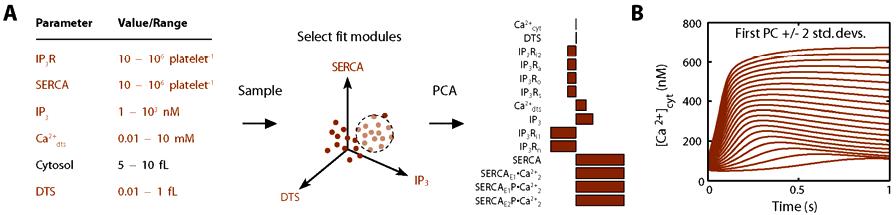
- Figure S2. Percent coverage of IC space by principal component vectors of platelet modules (JPG, 41 KB) -
PC vectors representing linear combinations of the ICs in each module were calculated from large (>104) collections of calibrated sample points from each module. The cumulative percent of the IC space covered by these vectors, as determined by the associated eigenvalue, are shown for each module.
- Figure S3. Calculation of Ca2+ spiking frequency distribution (JPG, 86.4 KB) -
(A) 600 s Ca2+i traces from 100 stochastic simulations were sampled every 1 s. (B) The derivative of each trace was calculated, and a noise threshold of 10 nM s−1 was used to count the peak-to-peak interval times for each trace.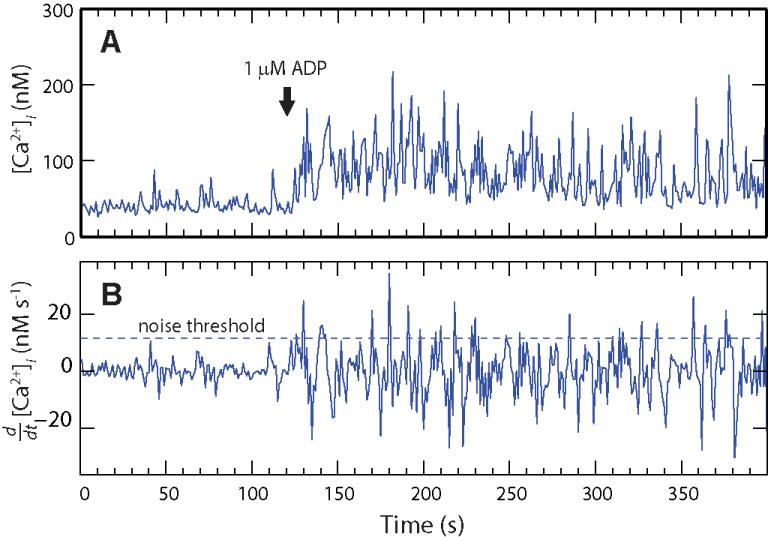
- Figure S4. Increased P2Y1 copy number enhances Ca2+ release in platelet model (JPG, 60.1 KB) -
The surface concentration of P2Y1 in the best-fit platelet model was increased 10-fold and steady-state was reestablished. At t = 0, both models were activated with the indicated concentrations of extracellular ADP.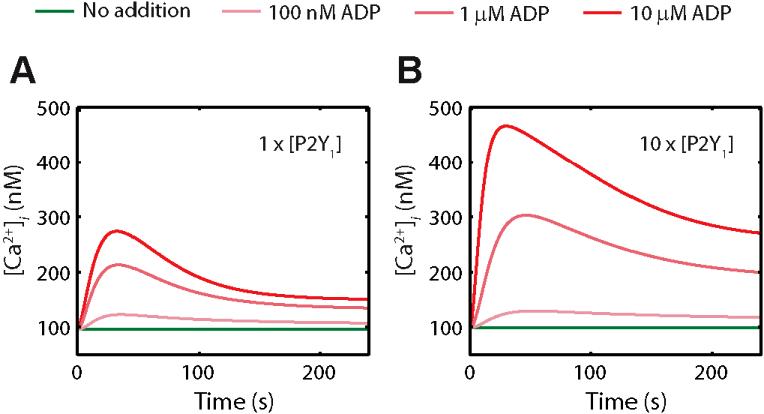
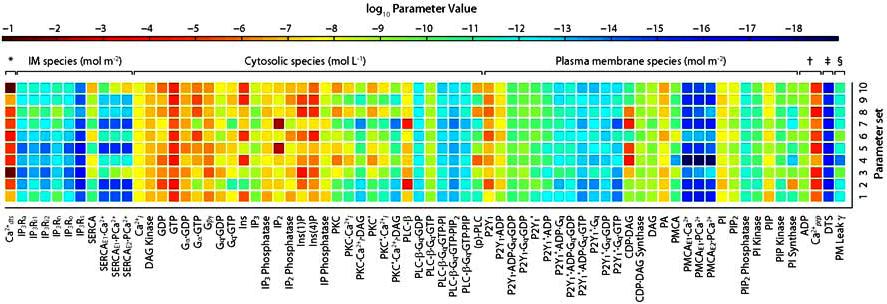
- Figure S5. IC map for 10 best-fit platelet models (JPG, 82.7 KB) -
Raw values for model quantities (steady-state concentrations, compartment sizes, or kinetic parameters) are color-coded according to the indicated units for each value type. Note color bar on right-hand side of figure. In most cases, colors correspond to molar concentrations (mol/L or mol/m2, see footnote). For example, Ca2+dts values shaded orange correspond to molar values of ′1–10 µM. Many quantities displayed a narrow range of values (e.g., PLC-β ·Gq·GTP, IP3, DAG Kinase) that reflect either imposed restrictions based on experimental evidence or implicit constraints due to the model structure (see Discussion section in main text). Other quantities varied considerably (e.g., IP2 and CDP·DAG). Species are grouped according to compartment. * DTS species (mol L−1). † Extracellular species (mol L−1). ‡ DTS volume (L). § PM leak conductance/area (S m−2).