Blood, Vol. 113, Issue 4, 953-962, January 22, 2009
Anti-CD3 preconditioning separates GVL from GVHD via modulating host dendritic cell and donor T-cell migration in recipients conditioned with TBI
Blood Li et al. 113: 953
Supplemental materials for: Li et al
Files in this Data Supplement:
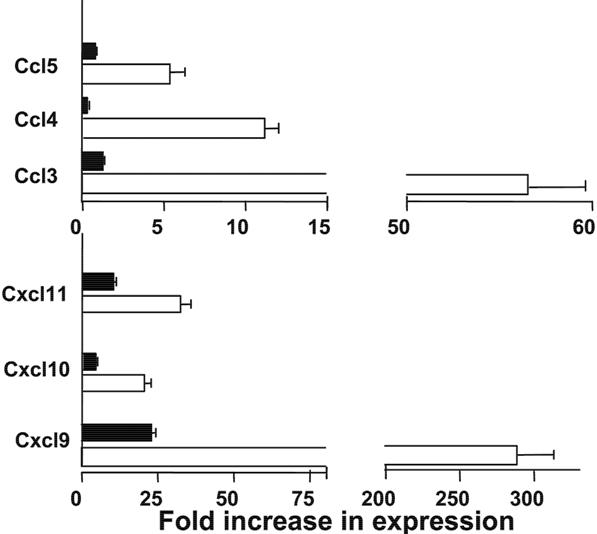
- Figure S1. Anti-CD3 preconditioning inhibited liver tissue expression of chemokines (JPG, 30.8 KB) -
Five days after HCT, liver tissue expression of Ccl3-5 and Cxcl9¬11 was measured with real-time PCR. Mean ± SE of 4 replicate experiments is shown.
- Figure S2. Retinoid acid(RA) induced donor T-cell expression of α4β7 and CCR9 during culture with host spleen DCs or MLN DCs from anti-CD3–preconditioned mice (JPG, 126 KB) -
Sorted CD4+ T cells (0.2 × 10⁶) were stimulated with CD11c+ DCs (0.1 × 10⁶) from spleens of BALB/c mice without anti-CD3 preconditioning (A) or MLN DCs from BALB/c mice preconditioned with anti-CD3 (B) in the presence or absence of RA in culture. Four days after culture, donor CD4+ T-cell expression of α4β7 and CCR9 was measured with flow cytometry. The α4β7+ or CCR9+ CD4+ T cells are gated. One representative of 3 replicate experiments is shown.
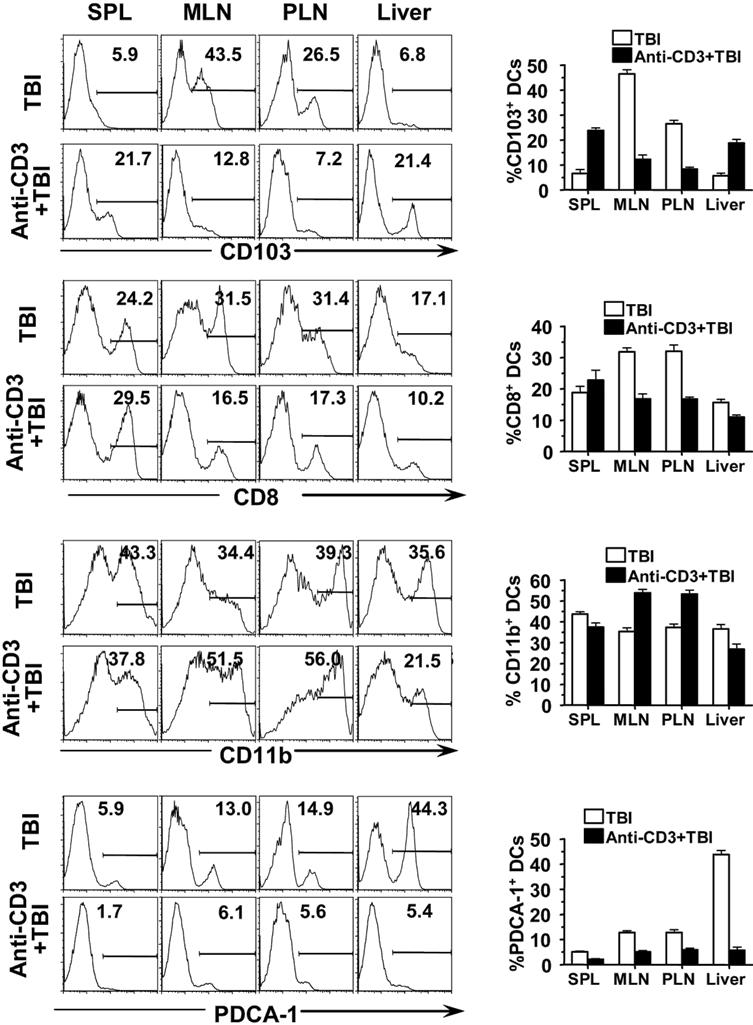
- Figure S3. Anti-CD3 preconditioning changed host DC subset tissue distribution (JPG, 131 KB) -
CD11c+ DCs from BALB/c mice with or without anti-CD3 preconditioning were enriched from spleen, MLN, PLN, and liver, and their expression of CD103, CD8, CD11b, and PDCA-1(a marker for plasmacytoid DCs) was analyzed with flow cytometry. One representative FACS pattern of 4 replicate experiments and the mean ± SE of the percentage of CD103+, CD8+, CD11b+ or PDCA-1+ cells among CD11c+ DCs are shown.
- Figure S4. Anti-CD3 preconditioning increased the percentage of Foxp3+ Treg cells among donor CD4+ T cells (JPG, 45.2 KB) -
Five days after HCT, spleen cells from BALB/c recipients with or without anti-CD3 preconditioning were stained with anti–H-2b, CD4, TCR-β, and Foxp3. (A) A representative FACS pattern of 4 replicate experiments. (B) Mean ± SE of the percentage of Foxp3+ CD4+ T cells among total donor CD4+ T cells.
- Figure S5. Anti-CD3 preconditioning did not change the host DC’s capacity in stimulating donor T-cell proliferation and Th1 differentiation (JPG, 38.1 KB) -
Donor C57BL/6 spleen cells (0.2 × 10⁶) were stimulated with sorted CD11c+ DC cells (0.1 × 10⁶) from spleen of host BALB/c mice with or without anti-CD3 preconditioning. T-cell proliferation was measured with 3H-TdR incorporation 72 hours after culture (A), and percentage of IFN-γ–secreting CD4+ and CD8+ T cells were measured by intracellular staining 96 hours after culture (B). One of three replicate experiments is shown.
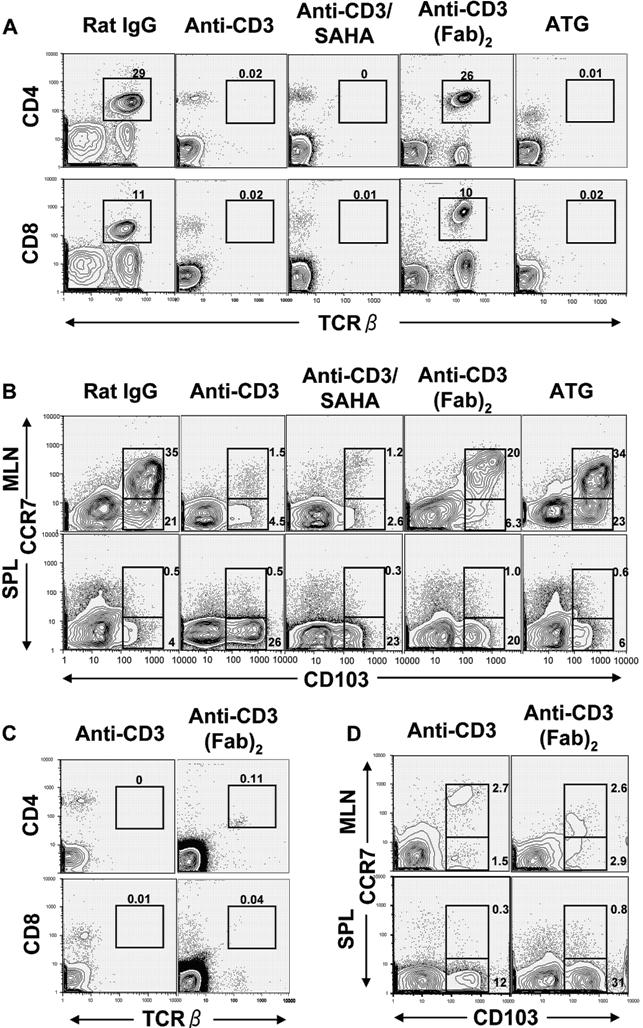
- Figure S6. Anti-CD3, anti-CD3/SAHA, anti-CD3 (Fab)2 but not ATG preconditioning modulated host DC tissue distribution (JPG, 140 KB) -
In the current studies, modulation of DC tissue distribution via anti-CD3 preconditioning was in association with host T-cell activation, which was associated with downregulation of TCRαβ receptor and depletion of TCRαβ+ T cells in peripheral blood. Therefore, we first tested if anti¬CD3, anti-CD3/SAHA, anti-CD3 (Fab)2, and ATG had similar effect on activation of host peripheral blood T cells. Accordingly, BALB/c recipient mice were injected with anti-CD3 (5 µg/g), anti-CD3 (5 µg/g), and SAHA (40 µg/g), anti-CD3 (Fab)2 (5 µg/g), ATG (50 µg/g) or control Rat IgG (50 µg/g). The CD4+ and CD8+ TCRαβ+ T cells were checked on days 3, 5, 7, and 9 after antibody injection. The TCRαβ+ T cells in blood were not detectable from days 3 to days 9 after injection of anti-CD3, anti-CD3/SAHA or ATG. However, TCRαβ+ T cells in blood of anti-CD3 (Fab)2 treated mice gradually came back and reached close to normal level by day 9, although it was not detectable on day 3 (see Panels A and C). The DC subset change was first compared on day 9. Although anti-CD3 and anti-CD3/SAHA treatment markedly reduced CCR7+CD103+ DCs in MLN, anti-CD3 (Fab)2 only partially reduced the CCR7+CD103+ DCs in MLN, and ATG treatment did not reduce CCR7+CD103+ DCs in MLN at all (see Panel B). Since the peripheral blood T cells were not detectable by day 3, but came back already by day 9 after anti¬CD3 (Fab)2 injection, the DC subset change in MLN of mice treated with anti-CD3 or anti-CD3 (Fab)2 was compared again by day 3 after injection, and anti-CD3 (Fab)2 treatment also markedly reduced CCR7+CD103+ DCs in MLN 3 days after treatment (see Panel D). (A) Peripheral blood T cells were analyzed with flow cytometry nine days after injection. (B) Nine days after antibody injection, CD11c+ DC-enriched MLN and spleen cells were stained with anti-CD11c, CD103, and CCR7. Gated CD11c+ cells were shown in CD103 versus CCR7. CCR7+CD103+ and CCR7−CD103+ cells among total CD11c+ cells are gated and their percentages are shown beside the gating boxes. C, Peripheral blood T-cell patterns 3 days after anti-CD3 or anti-CD3 (Fab)2 injection. (D) CD11c+ DC patterns 3 days after anti-CD3 or anti-CD3 (Fab)2 injections. One representative of 3 replicate experiments is shown.
- Figure S7. Anti-CD3 but not ATG preconditioning prevented acute GVHD (JPG, 33.1 KB) -
BALB/c recipients were preconditioned with anti-CD3 (5 µg/g), ATG (50 µg/g) or control Rat IgG (50 µg/g) on day-9. On day 0, the mice were given 800 rads TBI. 6 hours later, the recipients were transplanted with TCD-BM (5 × 10⁶) and spleen cells (2.5 × 10⁶) from C57BL/6 donors. Thereafter, the recipients were monitored for clinical signs of GVHD, bodyweight and survival daily. There were 8 recipients in each group. (A) Clinical score (mean ± SE) of GVHD of the recipients. (B) Bodyweight changes (mean ± SE) of the recipients. C, Survival percentage of the recipients.