Blood, Vol. 113, Issue 8, 1756-1758, February 19, 2009
A role for MEIS1 in MLL-fusion gene leukemia
Blood Kumar et al. 113: 1756
Supplemental materials for: Kumar et al
4166 cell line
Spleen cells isolated from the mouse were cultured in methylcellulose medium (Methocult GF, M3534. Stem Cell Technologies, Vancouver, BC) supplemented with GM-CSF (10 ng/mL) for three serial cultures. Colonies in methylcellulose medium were harvested and grown in ASM liquid medium (DMEM with 10% FBS, 10 ng/mL IL-3, 10 ng/mL IL-6, 20 ng/mL SCF,10 ng/mL GM-CSF, 0.2 U/mL insulin, 10−5 M 2-mercaptoethanol, 0.01 M sodium pyruvate, 1% non-essential amino acids and 1mM oxaloacetic acid). When the cells were fully adapted to the liquid culture, cytokines were sequentially withdrawn from the medium until IL-3 was the only cytokine required for proliferation. The cells were routinely maintained in 4166 medium (IMDM containing 15% FBS and 2ng/ml IL-3).
Lentivirus
We screened five murine Meis1 shRNA clones from OpenBiosystems (Huntszlle, AL; Accession#: NM_ 010789; source ID: TRCN0000012523, TRCN0000012524, TRCN0000012525, TRCN0000012526, TRCN0000012527). For ease of description these clones were designated M23, M24, M25, M26 and M27 respectively. Using the online RNAi designer from Invitrogen (https://rnaidesigner.invitrogen.com/sirna/), we also cloned four additional shRNAs with a 19-base pair core sequence into the lentivirus expression vector pLL3.7 that carries an eGFP marker. One of these clones designated M1456 (5′AACGGATAACAGCAGTGAGCAATTCAAGAGATTGCTCACTGCTGTTATCCTTTTTTC3′) exhibited significant Meis1 silencing in 4166 cells. The human MEIS1 shRNA clones were also obtained from Open Biosystems (accession# NM_002398, source ID: TRCN0000015968, TRCN0000015969, TRCN0000015970, TRCN0000015971, TRCN0000015972).
The RNAi consortium (TRC) shRNAs were designed to include a hairpin of 21 base-pair sense and antisense stem, a 6 base-pair loop and cloned into the pLKO.1 lentivirus vector that carries a puromycin resistance marker. Lentivirus was produced by co-transfecting lentivirus expression vectors and packaging plasmids pMDG and pCMVR 8.91 into 293T cells. Briefly, 293T cells were grown in 6-well plates to 8 × 10⁵ cells/well in DMEM medium with 10% FBS. Media were replaced on the day of transfection. One hundred microliters of Fugene 6 transfection mix (Roche, Indianapolis, IN) containing 2 ∝g plasmid DNA mix were added to the wells drop-wise and mixed well. Culture supernatants containing pseudovirus were harvested 48–72 h post-transfection. For pKLO.1 mediated shRNAs, viral titers were determined by transduction of NIH3T3 cells using diluted culture supernatants and determining number of viable cells after 4–5 days of culturing in the presence or absence of puromycin. Titers of M1456 lentivirus were determined by transducing 293T cells with diluted culture supernatants and determining percentage of eGFP positive cells by flow cytometry. To transduce target cells, lentivirus containing culture supernatants were filtered through a 0.45µ filter (Millipore Bedford, MA) and concentrated by ultracentrifugation at 25,000 rpm for 2 hours. The pellets were resuspended in serum-free IMDM. Unless specified, a multiplicity of infection (MOI) of 100 was used in subsequent experiments by spin transduction.
Gene expression analysis
For gene expression profiling experiments, 4166 cells were transduced with M26 or control virus for 48 hours in the presence of Puromycin. RNA was extracted using the RNeasy mini kit (Qiagen, Valencia, CA) and quality assessed using the 2100 Bioanalyzer (Agilent, Santa Clara, CA). Meis1 knockdown was confirmed by real time quantitative RT-PCR before proceeding to the next step. Labeling of RNA was performed using the 1 cycle labeling reagents as described (Affymetrix, Santa Clara, CA). Hybridization, washing and scanning were performed as described by the manufacturer. The gene expression data were pre-processed using robust multi-array average. The experiment was a matched design that could control for unknown variation of no biological interest and needs to be accounted for in differential gene expression detection. We first obtained the paired expression differences of the Meis1-knockdown and control-virus transduced cells. We then calculate the regularized t-statistic, which pools information across genes to define a two-sample paired t-statistic and could improve the overall detection power. To control for false positives, we calculate the false discovery rate (FDR, Benjamini and Hochberg 1995), which is defined as the expected proportion of false positives.
Files in this Data Supplement:
- Table S1. Genes displaying significant reduced expression with Meis1 knockdown in 4166 cells (selected by t-test, FDR -
Genes are ranked in descending order of fold change. - Figure S1. M26 induced Meis1 knockdown and growth inhibition in the 4166 cell line is efficient and specific (JPG, 31.9 KB) -
(A) 4166 cells either untreated or transduced with control virus or M26 were cultured with or without puromycin for 5 days and live cells were counted by Trypan blue exclusion. Cell growth was compared to untreated cells. M26 transduced cells showed reduced growth both in the presence or absence of puromycin. (N=3, pMeis1 was performed using Taqman primer/probes with Gapdh as housekeeping gene. The graph shows Meis1 mRNA levels in M26 transduced cells compared to control virus transduced cells grown in the presence of puromycin (N=5, pMeis1 negative murine cell lines C1498 and BaF3 were transduced with M26 or control virus for 5 days with or without puromycin. The graph shows no significant change in growth of M26 transduced cells compared to vector controls.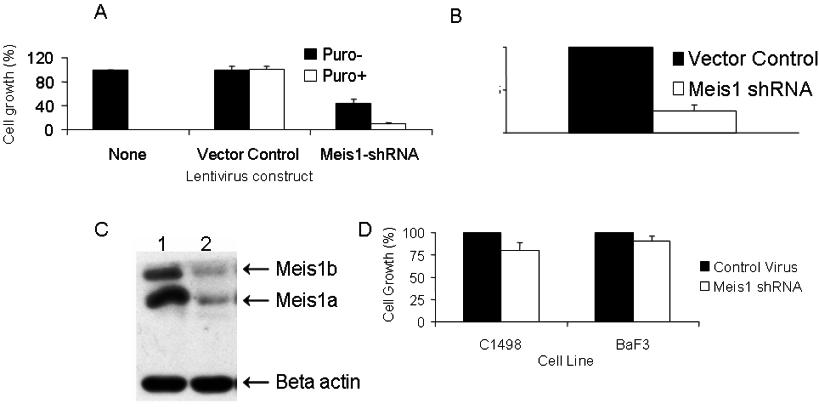
- Figure S2. Meis1 knockdown results in reduced clonogenic capacity and promotes differentiation of murine Mll-AF9 leukemia cells (JPG, 19.4 KB) -
4166 cells were transduced with M26 or control virus and cultured in semisolid methylcellulose media. (A) The number of colonies formed in methylcellulose was significantly reduced by M26 transduction (mean + std. err., n=3, p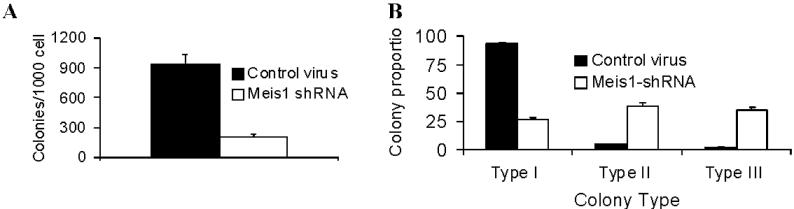
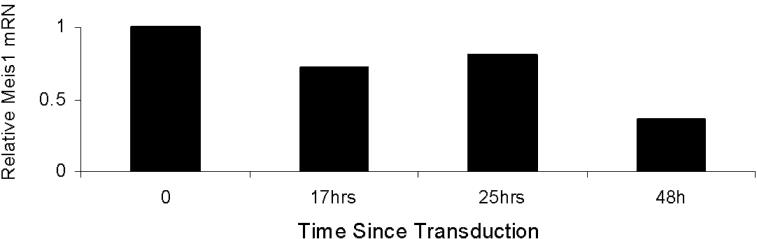
- Figure S3. At 48 hours post transduction with M26, 4166 cells display > 50% knockdown of Meis1 mRNA (JPG, 13.3 KB) -
4166 cells were transduced with M26 or control virus and harvested at the various time points shown in the graph. Meis1 mRNA levels were measured by real-time quantitative RT-PCR using Gapdh as housekeeping gene. Bars represent levels in M26 transduced cells compared to control virus transduced cells. In repeat experiments at 48 hours, Meis1 expression in M26 transduced cells was consistently