© RSNA, 2008
Appendix E1
The measurement techniques and landmarks are illustrated as follows: Continuous variables can represent any numeric value without gaps between possible responses. Categorical values are binary or multivariate and limited to a finite predetermined set of responses.
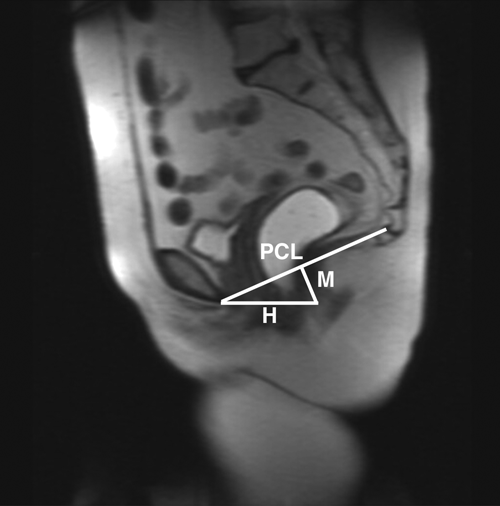
Measurements were based on sagittal, transverse, coronal, and oblique coronal MR images. On sagittal images, the PCL, as represented by the anteroposterior outlet, was used to demarcate the pelvic floor (Fig E1). The PCL was measured from the inferior margin of the symphysis pubis to the last vertical joint of the coccyx. Rest and maximal-strain images in the midsagittal plane (Fig E1) were obtained to evaluate the descent of the bladder and anorectal junction, measure the anteroposterior length of the hiatus, and measure the angle of the levator plate relative to the PCL. For bladder descent, a perpendicular line was drawn from the PCL to the neck of the urinary bladder (Fig E1b). The anteroposterior length of the hiatus (H-line) was a line drawn from the inferior tip of the symphysis pubis to the posterior rectal wall at the anorectal junction (Fig E1a). For anorectal location relative to the PCL (M-line), a line was drawn from the anorectal junction to intersect the PCL perpendicularly (Fig E1a).
 | Figure E1a. Cystocele. Dynamic sagittal T2-weighted images obtained (a) at rest and (b) during Valsalva maneuver show the abnormal descent of the urinary bladder neck (arrow) 2 cm below the PCL, consistent with cystocele. The rectum, filled with contrast material, has normal contour and position. In a, the H-line (H) and M-line (M) are included for illustrative purposes. |
 | Figure E1b. Cystocele. Dynamic sagittal T2-weighted images obtained (a) at rest and (b) during Valsalva maneuver show the abnormal descent of the urinary bladder neck (arrow) 2 cm below the PCL, consistent with cystocele. The rectum, filled with contrast material, has normal contour and position. In a, the H-line (H) and M-line (M) are included for illustrative purposes. |
For the angle of the levator plate, a line along the levator plate at the posterior rectal wall was intersected by the PCL, and the resulting angle was measured. The presence of rectocele was defined as anterior protrusion of the rectal wall of more than 2 cm beyond the projected cephalad extension of a line drawn along the anterior rectal wall at the level of the anal sphincter (Fig E2). The presence of enterocele was defined as small bowel extending between the rectum and vagina. Bone measurements on midline sagittal images included sacral length and depth and obstetric conjugate (Fig E3). Sacral length was measured from the sacral promontory to the tip of the sacrum. From this line, a perpendicular line extending to the deepest part of the sacrum was measured to represent sacral depth. The obstetric conjugate was measured as a line from the sacral promontory to the nearest point on the posterocranial aspect of the symphysis pubis.
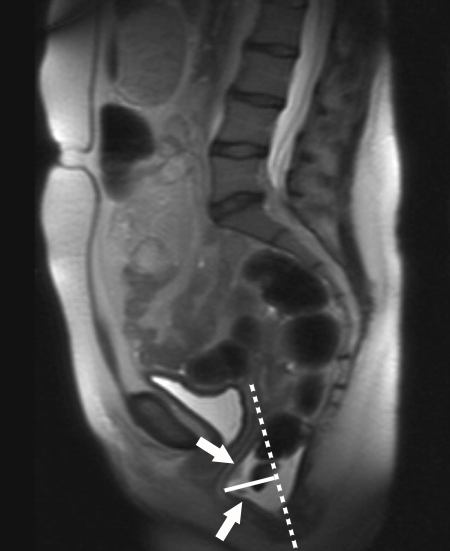 | Figure E2. Rectocele. Sagittal T2-weighted image demonstrates convex bowing of the anterior rectal wall of more than 2 cm (arrows). The solid line shows the distance measurement from the projected extension of the anal canal (dotted line). |
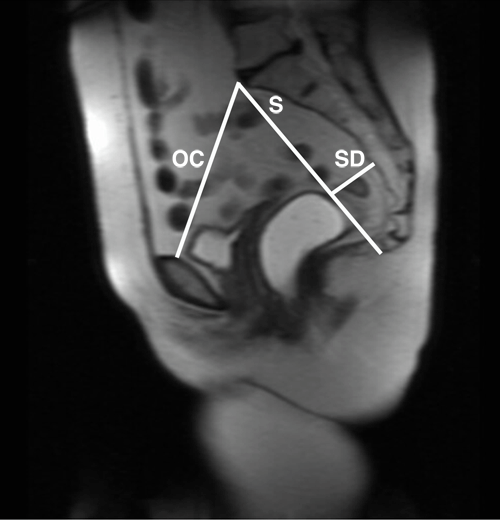 | Figure E3. Sagittal T2-weighted image obtained at rest demonstrates normal measurements of the obstetric conjugate (OC), sacral length (S), and sacral depth (SD). |
On transverse images, the width of the levator hiatus, presence or absence of muscle tears, width of the levator sling muscle, and vaginal shape were reported (Fig E4). The width of the hiatus was measured at the level of the superior margin of the symphysis pubis. At this level, a transverse line was drawn between the widest points of the levator hiatus, defined on T2-weighted images as the medial aspects of the hypointense levator muscles. A muscle tear on T2-weighted images was defined as discontinuity of the hypointense muscle at any point along its course to the pubic bones (Fig E5). The width of the levator sling muscle was measured at the level of the constrictor urethrae muscle. In the anteroposterior plane, muscle thickness was measured at the level of the mid-vagina. The high signal intensity of fat on T2-weighted images allowed clear delineation of muscle margins. Bone measurements included intertuberous distance, interspinous distance, and angle of the pelvic arch. The intertuberous distance was measured at the level of the symphysis pubis between the inferior rami (Fig E6). At the same level, a line was drawn through each ramus to the symphysis pubis, and the resultant angle was measured as the angle of the pelvic arch (Fig E6). The interspinous distance was defined as the shortest distance between the ischial spines, as visualized on a single transverse image (Fig E7).
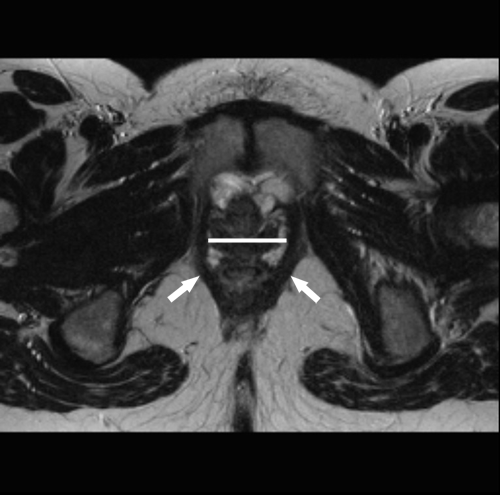 | Figure E4. Width of levator sling muscle. Transverse T2-weighted image shows normal thickness of the puborectalis muscles (arrows). The line demonstrates the width of the levator hiatus. |
 | Figure E5. Levator muscle defect. Transverse T2-weighted image shows disruption of the right levator muscle (arrow), with lack of normal continuity to the symphysis pubis. |
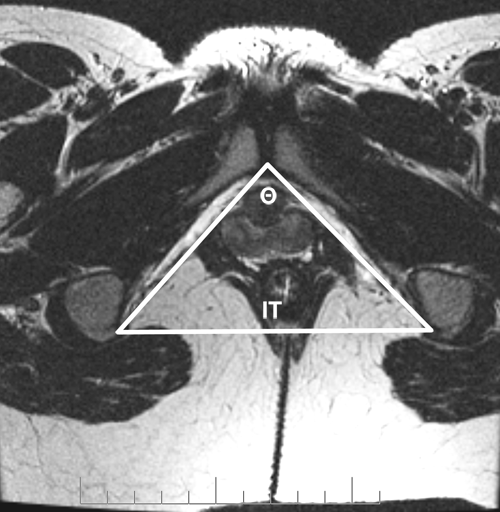 | Figure E6. Transverse T2-weighted image shows measurement of the intertuberous (IT) distance and the angle of the pubic arch with the apex at the symphysis pubis (Θ). |
 | Figure E7. Transverse T2-weighted image depicts measurement of the interspinous distance (line) between the ischial spines. |
In the coronal plane, the shape of the iliococcygeus muscle was evaluated for loss of the normal superior bowing at the level of the vagina (Fig E8). Flattening of the muscle contour or outward curvature of the muscle was noted if present. The transverse inlet of the pelvis was measured at the level of the fovea of the femoral head, from the flattened segment of the iliac bone cephalad to the level of the fovea (Fig E9). On oblique coronal images obtained in the plane of the sacrum, the maximum transverse inlet diameter was measured from the medial wall of the iliac bone at the level of the sacral joint (Fig E10).
 | Figure E8. Coronal T2-weighted image through the rectum shows normal curvature of the puborectalis muscles (arrows). |
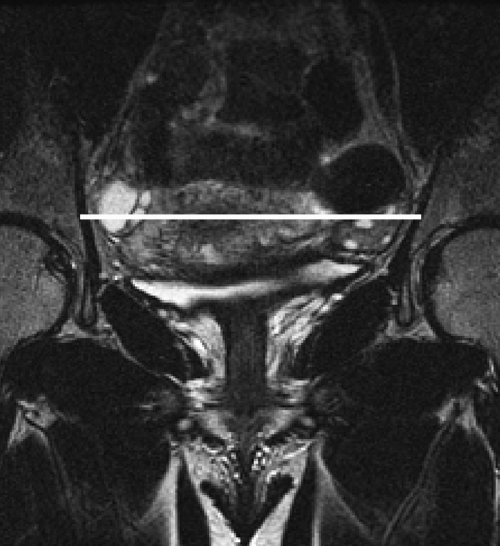 | Figure E9. Coronal T2-weighted image at the level of the fovea demonstrates transverse inlet measurement (line). |
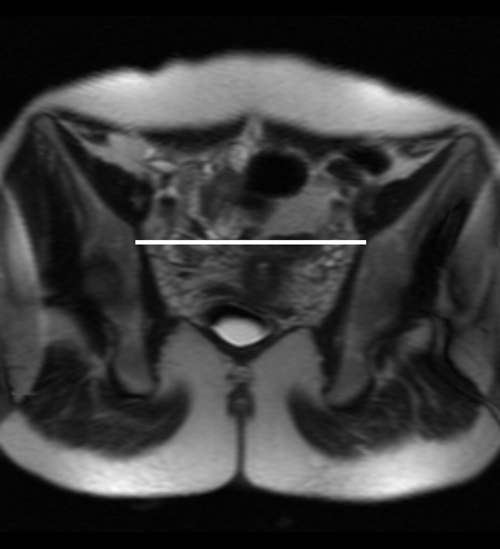 | Figure E10. Oblique coronal T2-weighted image shows measurement of the transverse diameter of the pelvis (line). |