Blood, Vol. 113, Issue 13, 3088-3091, March 26, 2009
Double CEBPA mutations, but not single CEBPA mutations, define a subgroup of acute myeloid leukemia with a distinctive gene expression profile that is uniquely associated with a favorable outcome
Blood Wouters et al. 113: 3088
Supplemental materials for: Wouters et al
Files in this Data Supplement:
- Document 1. Supplemental materials and methods (PDF, 46.7 KB)
- Table S1. Mutations detected in CEBPA coding sequence (PDF, 51.8 KB)
- Table S2. 19-probe set signature for CEBPAmut in the context of the entire AML cohort (PDF, 20.4 KB)
- Table S3. 21-probe set signature for CEBPAdouble-mut in the context of the entire AML cohort (PDF, 21.1 KB)
- Table S4. Clinical and molecular characteristics of 524 AML cases included in gene expression profiling and survival analyses (PDF, 30.6 KB)
- Table S5. Clinical and molecular characteristics of CEBPAwt, CEBPAsingle-mut, and CEBPAdouble-mut AML cases included in gene expression profiling and survival analyses (PDF, 41.2 KB)
- Table S6. Multivariable analysis of CEBPA mutations as prognostic marker for overall survival and event-free survival in patients aged below 60 years (A) and patients with normal cytogenetics (B) (PDF, 28.2 KB)
- Figure S1. Principal component analysis of gene expression data based on 19-probe set prediction signature for CEBPA mutations (JPG, 57.1 KB) -
Principal component analysis of 524 cases of AML was carried out based on the 19 probe sets in the CEBPAmut gene expression classifier, so irrespective of single or double mutant status (Table S2). Each square represents an AML case. AMLs are color coded based on CEBPA status: CEBPAdouble-mut (red), CEBPAsingle-mut (blue) and CEBPAwt (yellow). Cases belonging to a previously described subgroup of myeloid/T-lymphoid leukemias characterized by epigenetic silencing of CEBPA have been colored in green (“CEBPA silenced AMLs”).1 The first two principal components (PCA1 and PCA2) have been depicted. The figure illustrates that CEBPAdouble-mut can be completely separated from CEBPAwt cases over the first principal component (PCA1), while the CEBPAsingle-mut cases are scattered within the wild type cohort. In addition to CEBPAdouble-mut, there are also some other AMLs that are clearly separated from the wild type cohort — these all represent CEBPA silenced AMLs.
- Figure S2. Unsupervised principal component analysis of gene expression data (JPG, 43.4 KB) -
Unsupervised principal component analysis of all available gene expression data for all CEBPA mutant specimens (N=38) was carried out to uncover the underlying variability in gene expression. Each AML cases is represented by a square and colored according to its status, i.e. CEBPAdouble-mut (red) or CEBPAsingle-mut (blue). The first two principal components (PCA1 and PCA2) have been depicted and capture the majority of variability in gene expression of the 54675 probe sets on the microarrays.
- Figure S3. Kaplan Meier estimates for overall (OS) and event-free (EFS) survival restricted to patients less than 60 years of age or patients with normal cytogenetics (JPG, 92.6 KB) -
(A) Restricted analysis to patients less than 60 years of age: OS among CEBPAdouble-mut versus CEBPAwt AML, P=0.0096, and versus CEBPAsingle-mut AML, P=0.033; pooled P=0.031 (B) Restricted analysis to patients with normal cytogenetics: OS among CEBPAdouble-mut versus CEBPAwt AML, P=0.069, and versus CEBPAsingle-mut AML, P=0.024; pooled P=0.069. (C) Restricted analysis to patients less than 60 years of age: EFS among CEBPAdouble-mut and CEBPAwt AML, P=0.014, and versus CEBPAsingle-mut AML, P=0.026; pooled P=0.028 (D) Restricted analysis to patients with normal cytogenetics: EFS among CEBPAdouble-mut and CEBPAwt AML, P=0.081, and versus CEBPAsingle-mut AML, P=0.093; pooled P=0.15.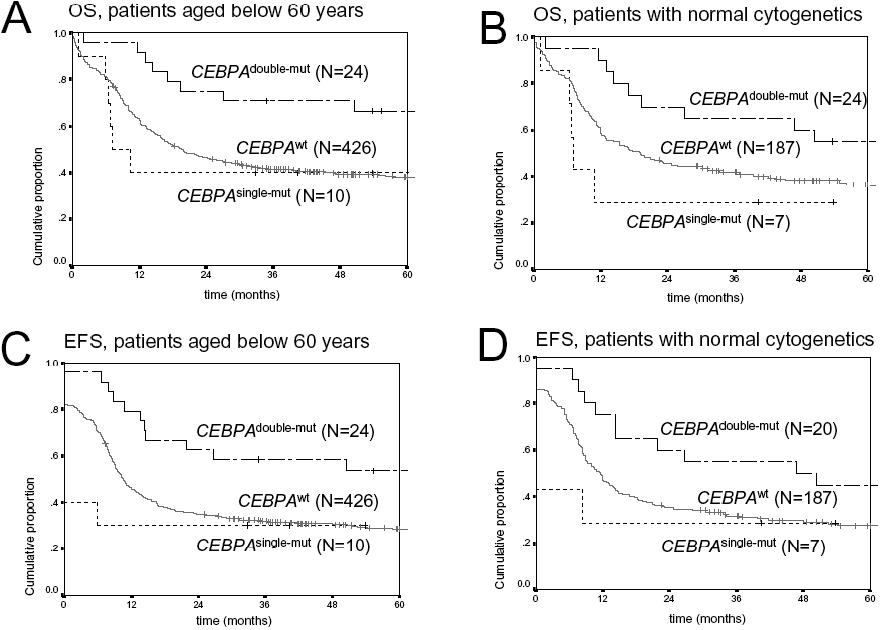
- Figure S4. Kaplan Meier estimates for overall (OS) and event-free survival (EFS) (JPG, 68.5 KB) -
(A) OS among CEBPAmut versus CEBPAwt AML in the presence of favorable cytogenetics (CEBPAwt/good cytog.) and versus CEBPAwt AML in the presence of other cytogenetics (CEBPAwt/other cytog.). (B) OS among CEBPAdouble-mut, CEBPAsingle-mutCEBPAwt/good cytog and CEBPAwt/other cytog. (C) EFS among CEBPAmut versus CEBPAwt AML in the presence of favorable cytogenetics (CEBPAwt/good cytog.) and versus CEBPAwt AML in the presence of other cytogenetics (CEBPAwt/other cytog.). (D) EFS among CEBPAdouble-mut, CEBPAsingle-mutCEBPAwt/good cytog and CEBPAwt/other cytog. In none of the panels A–D, there was a statistically significant difference (defined as PCEBPAwt/good cytog and CEBPAmut or CEBPAwt/good cytog and CEBPAdouble-mut, respectively.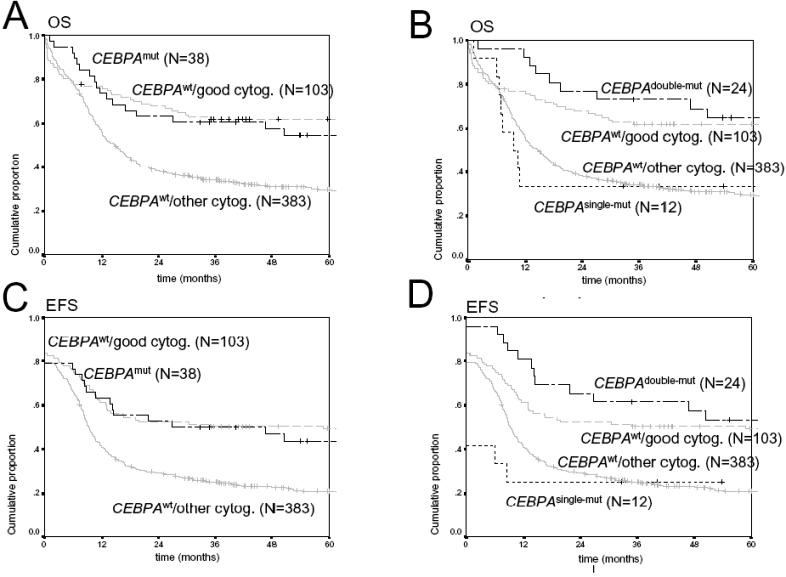
REFERENCE
1. Wouters BJ, Jorda MA, Keeshan K, et al. Distinct gene expression profiles of acute myeloid/T-lymphoid leukemia with silenced CEBPA and mutations in NOTCH1. Blood. 2007;110:3706-3714.