Blood, Vol. 113, Issue 25, 6411-6418, June 18, 2009
MicroRNA-29b induces global DNA hypomethylation and tumor suppressor gene reexpression in acute myeloid leukemia by targeting directly DNMT3A and 3B and indirectly DNMT1
Blood Garzon et al. 113: 6411
Supplemental materials for: Garzon et al
Pyrophosphate sequencing
ESR1 Original sequence (AY425004: nt 2338 – nt 2682):
GGGATGGCCCTACTGCATCAGATCCAAGGGAACGAGCTGGAGCCCCTGAACCGTCCGCAGCTCAAGATCCCCCTGGAGCGGCCCCTGGGCGAGGTGTACCTGGACAGCAGCAAG
Bisulfite converted sequence:
GGGATGGTTTTATTGTATTAGATTTAAGGGAAYGAGTTGGAGTTTTTGAATYGTTYGTAGTTTAAGATTTTTTTGGAGYGGTTTTTGGGYGAGGTGTATTTGGATAGTAGTAAG
Files in this Data Supplement:
- Figure S1. miR-29b expression in AML cell lines at baseline and after transfection of pre-miR-29b (JPG, 78.5 KB) -
(A) Northern Blotting showing the miR-29b expression in a panel of AML cell lines. RNA loading was performed by measuring U6. (B) miR-29b expression after pre-miR-29b or scrambled transfection in K562 cells (upper panel) or MV4-11 cells (lower panel) as measured by Northern Blotting. RNA loading control was performed by staining the gels with ethidium bromide (EB). (C) Transfection efficiency in K562 and MV4-11 cells was assessed by measuring green fluorescent protein (GFP) expression by FACS after co-transfection of a GFP reporter plasmid with the pre-miR-29b or scrambled oligos, since the ambion miR-29b precursors are not labeled. Lentivirus infection efficiency was assessed by measuring GFP expression (lentivirus contain GFP) by FACS (C) and fluorescent microscope (D) at 24 hours. (E) qRT-PCR of miR-29b in kasumi-1 cells infected with miR-29b lentivirus or empty vector.
- Figure S2. miR-29b expression in primary AML patients transfected with pre-mir-29b (JPG, 21.2 KB) -
(A) miR-29b expression in 3 AML samples after transfection with pre-miR-29b or scrambled oligonucleotides.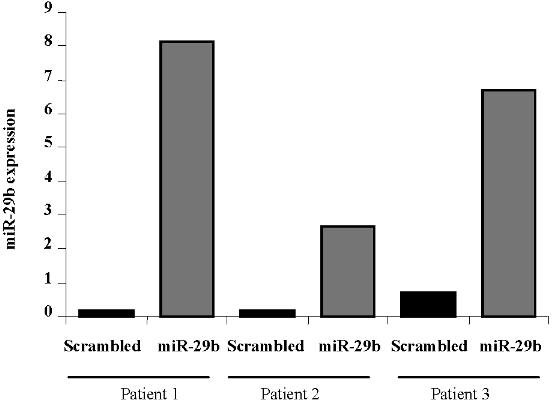
- Figure S3. Silencing Sp1 induces DNMT1 down-regulation, decreased global DNA methylation and ESR1 gene re-expression in K562 cells (JPG, 58.9 KB) -
(A) Western Blotting for DNMT1 and Sp1 in K562 cells transfected with 100 nM of siRNA pools against Sp1 or siRNA scrambled oligonucleotide (right panel). As an additional control K562 cells were treated with decitabine or PBS (control) (left panel). As shown in the right panel, Sp1 siRNAs silences effectively Sp1 and induces DNMT1 down-regulation. As expected decitabine down-regulates DNMT1 protein but did not affect Sp1 expression levels (left panel). (B) DNMT1 mRNA expression in K562 cells transfected with Sp1 siRNAs or with controls. (C) Global DNA methylation (GDM) analysis in K562 cells transfected with Sp1 siRNA cells or with controls. As a control we performed GDM analysis in K562 cells treated with decitabine or control (PBS). (D) ESR1 mRNA expression in K562 cells treated with decitabine, PBS (control), Sp1 siRNA and siRNA scrambled oligonucleotide (control) as measured by qRT-PCR as described in methods. Histograms show mean values with SD.
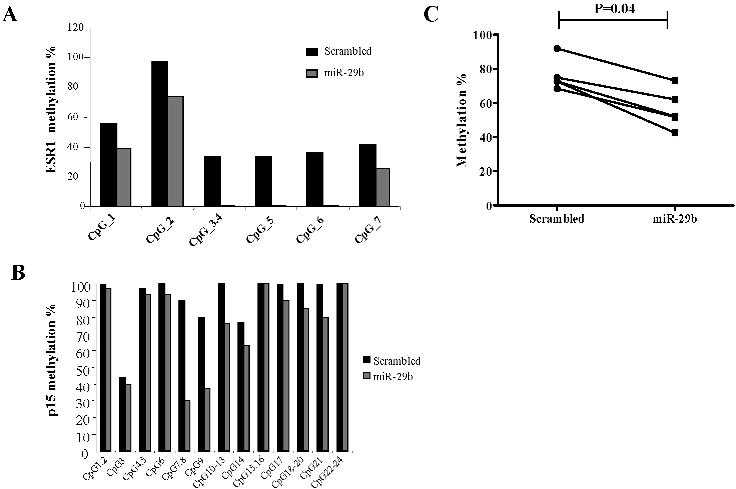
- Figure S4. ESR1 and p15INK4 promoter DNA methylation analysis after transfection of miR-29b in AML cell lines (JPG, 41.7 KB) -
(A) Histograms show the DNA methylation percentage for each single CpG or a group of CpGs analyzed of the ESR1 or (B) p15INK4 gene. (C) Scatter plots of the quantitative DNA methylation data obtained pyrophosphate sequencing of ESR1 in MV4-11 cells after nucleoporation with pre-miR-29b (■) or a scrambled oligonucleotide (●). Each dot represents a single CpG or a group of CpGs analyzed. The lines connecting the dots indicate the corresponding CpGs pairs. The scatter plots were created using GraphPad Prism version 5.00 for Windows, GraphPad Software, San Diego California USA, www.graphpad.comGraphPad Prism. The P-values were obtained comparing the CpGs methylation levels between scrambled and pre-miR-29b transfected cells using Paired Wilcoxon signed-rank test.