Blood, Vol. 114, Issue 6, 1186-1195, August 6, 2009
Cell-nonautonomous function of Id1 in the hematopoietic progenitor cell niche
Blood Suh et al. 114: 1186
Supplemental materials for: Suh et al
Files in this Data Supplement:
- Table S1. Primer sequences used for real-time PCR (PDF, 14.4 KB)
- Figure S1. Id1−∕− mice have reduced numbers of B220+ bone marrow cells (JPG, 87 KB) -
BMC and thymocytes were harvested from Id1−∕− and Id1+∕+ mice and analyzed for (A) B lineage cells in the BM using B220 and CD43 antibodies and, (B) T lineage cells in the thymus using CD4 and CD8 antibodies. The numbers indicate the percentage of cells in each quadrant.
- Figure S2. Id1−∕− bone marrow cells contain increased percentages of side population cells (JPG, 10.8 KB) -
The percentage of side population cells in Id1−∕− or Id1+∕+ BMC was determined by Hoechst 33342 dye staining, and then analyzed by flow cytometry using a Moflow cell sorter (Dako). Side population cells were confirmed by comparing BMC treated with and without verapamil. Statistical significance between the percentage of side population cells in Id1−∕− and Id1+∕+ was determined by students t test (n=4, *p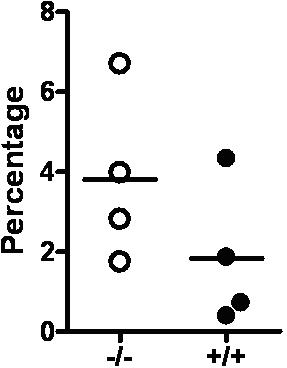
- Figure S3. Id1−∕− and Id1+∕+ mice have the same life span (JPG, 11.5 KB) -
Age matched Id1−∕− and Id1+∕+ mice were chosen from four different cohorts and the survival of two groups in animal facility was plotted for 600 days (n=18, p= 0.28).
- Figure S4. Id1−∕− bone marrow cells have normal osteogenic acitivity in vitro (JPG, 149 KB) -
(A) BM trabecular area in femur or tibia of Id1−∕− (n=6) and Id1+∕+ mice (n=5) was determined from H & E stained BM sections. (B) H & E stained longitudinal sections of femur from 12 week-old Id1+∕+ and Id1−∕− mice (Upper Panel, magnification, ×100). Consecutive femur sections were stained with tartrate resistant alkaline phosphate (TRAP) to detect osteoclasts (brown-stained cells, high-magnification image of multinucleated osteoclasts (inset, ×400)), Picrosirius red to detect bone, and Masson's trichrome for collagen (magnifications, ×200, ×40, and ×100 for second, third, fourth row, respectively). (C) Osteogenic activity of Id1−∕− and Id1+∕+ BMC was determined using Mesenchymal Stem Cell Osteogenesis Kit (Chemicon international). Osteocytes were fixed and stained with Alizarin Red solution and quantified by spectral analysis.
- Figure S5. Normal immunohistochemical staining for endothelial cells in Id1−∕− BM sections (JPG, 174 KB) -
Bone marrow sections from 12 week-old Id1+∕+ (left panels) and Id1−∕− (right panels) mice were analyzed by immunohistochemistry using antibodies that recognize VEGFR-2 and PECAM-1 (CD31). VEGFR-2 positive vessels (A, B) and PECAM-1 positive vessels (C, D) were detected in bone marrow of both Id1+∕+ and Id1−∕− mice. Dark brown colored cells indicate VEGF-R2+ (arrow head) or PECAM-1+ (arrow) cells (magnification ×100 for A and B, × 400 for C and C).