Blood, Vol. 114, Issue 6, 1243-1249, August 6, 2009
Differential expression of NADPH oxidases in megakaryocytes and their role in polyploidy
Blood McCrann et al. 114: 1243
Supplemental materials for: McCrann et al
Files in this Data Supplement:
- Table S1. Nox2 KO and Wt fresh BM show similar MK polyploidy profiles (PDF, 15.1 KB) -
Summary of ploidy status of freshly isolated Wt and Nox2 KO MKs expressed as a percentage of total MKs collected , n=4 mice per group. Nox2 KO, NADPH oxidase 2 knockout. - Figure S1. Immunofluorescence detection of Nox2 in freshly derived BM from wild type controls and Nox2 KO mice (JPG, 75 KB) -
Nox2 positive staining (green) in other BM cells is highlighted with white arrows (upper panels). A positive staining was not observed in wild type MKs. Nox2 expression was not observed in Nox2 KO BM (lower panels). Orange arrows distinguish autofluorescent signal (orange color). DAPI counterstain was used to stain nuclei and is shown with Nox2 staining in center panel. Images are shown at 600× magnification.
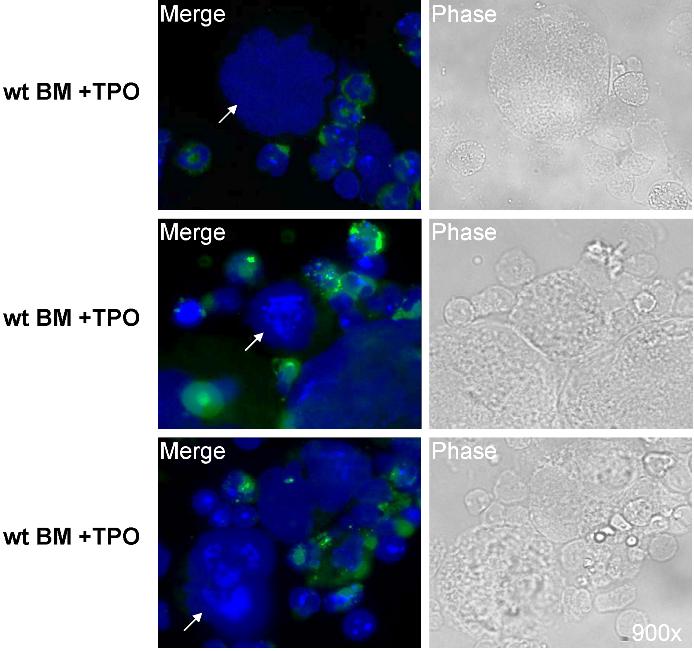
- Figure S2. Nox2 is not observed in mitotic MKs from wild type BM cultures stimulated with TPO (JPG, 72.9 KB) -
Nox2 staining of surrounding BM cells showed some punctate cytosolic staining, yet did not display detectable Nox2 levels in mitotic MKs (white arrows). Images are shown at 900× magnification.
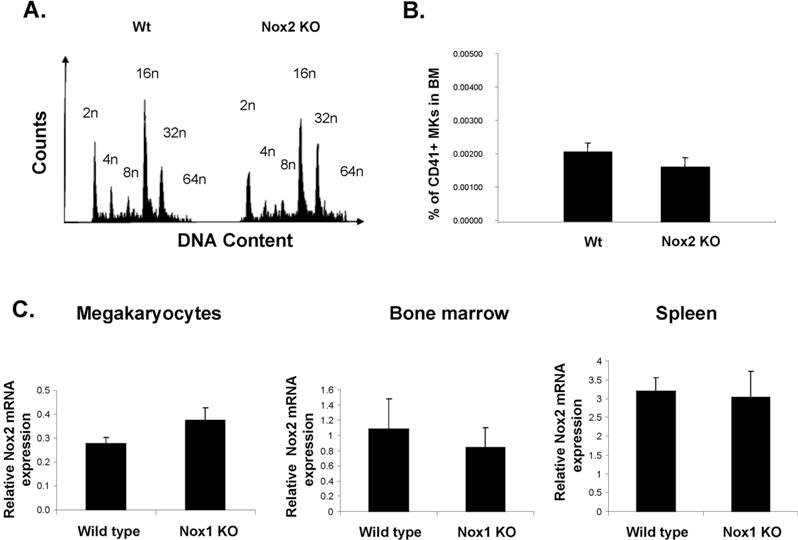
- Figure S3. Megakaryocytes (JPG, 57 KB) -
(A) MK ploidy profiles from wild type (Wt) and Nox KO mice. Fresh bone marrow from Wt and Nox2 KO mice was harvested and stained as described in Methods. Data shown are representative of 4 experiments. (B) MK number in fresh bone marrow was determined by FACS analysis using an antibody towards the MK marker, CD41. Although slightly different, the lower MK number in Nox2 KO mice was not statistically significant (Student’s t-test) (n = 3 mice per group). (C) Nox2 mRNA expression in Nox1 KO mice. Total bone marrow, spleen, and MKs were isolated from Nox1 KO mice. Quantitative RT-PCR analysis was applied to determine Nox2 expression. Nox2 levels were normalized to GAPDH expression, n=5 mice per group. Statistical analysis was applied using t-test for paired values. No significant difference was found (p> 0.05). Also, there is no compensation of Nox4 in Nox1 KO MKs (data not shown).