Files in this Data Supplement:
Fig. S1. Dystroglycan distribution during cell spreading on laminin. (A) Endogenous dystroglycan is localised to relatively small peripheral punctate structures during early phases of cell spreading t=30, 60, 120 and 180 minutes (top panels). Topographical profiles of dystroglycan fluorescence intensity (middle panels) and the surface projection (bottom panels) reveal the relative area and dystroglycan content of the structures formed. (B,C) For the first and the last cell in the series in A (i.e. at 30 and 180 minutes, respectively) a full confocal projection of vinculin immunostaining (V; red in merge) and dystroglycan (DG; green in merge) and a gallery of individual confocal sections from dorsal on the left to ventral on the right, shows co-localisation of dystroglycan and vinculin in the early but not the late stages of spreading. ‘}’ indicates the area of the cell represented in the confocal series. Scale bars: 20m (A,C), 10 m (B).
Fig. S2. Epifluorescence images of H2k myoblast cells stained for vinculin (red in merge) and β-dystroglycan (green in merge). Dystroglycan colocalises clearly and precisely with β-dystroglycan in both focal contacts and focal adhesions in all cells examined. Insets show a ×2.5 digital zoom of selected areas of the cells in series of panels.
Fig. S3. Dystroglycan is a resident of focal adhesions. (A) H2k myoblasts were subjected to ventral stripping and stained for vinculin or talin (red in merge) and endogenous β-dystroglycan or DG-GFP (green in merge). Contrary to the situation in whole cells, β-dystroglycan or DG-GFP could be seen to colocalise clearly with vinculin or talin in exposed ventral adhesions (arrows). (B) A partially stripped H2k myoblast cell stained with monoclonal anti-dystroglycan (A,A′, DG; red in merge), a polyclonal antiserum that recognises dystroglycan phosphorylated on tyrosine 890 (B,B′, PDG; green in merge) and for F-actin (C,C′, blue in merge). Both dystroglycan and phosphorylated dystroglycan are seen at the tips of actin stress fibres in a position consistent with their localisation to focal adhesion structures.
Fig. S4. H2k myoblasts adhere and spread differently depending on substrate. Cells were allowed to adhere to a variety of substrates (5 g/ml) and observed by phase microscopy during early spreading. The ability of cells to attain a normal adherent morphology within this time frame is substrate dependent. The level of dystroglycan expression did not affect initial attachment rate, as shown previously (Thompson et al., 2008).
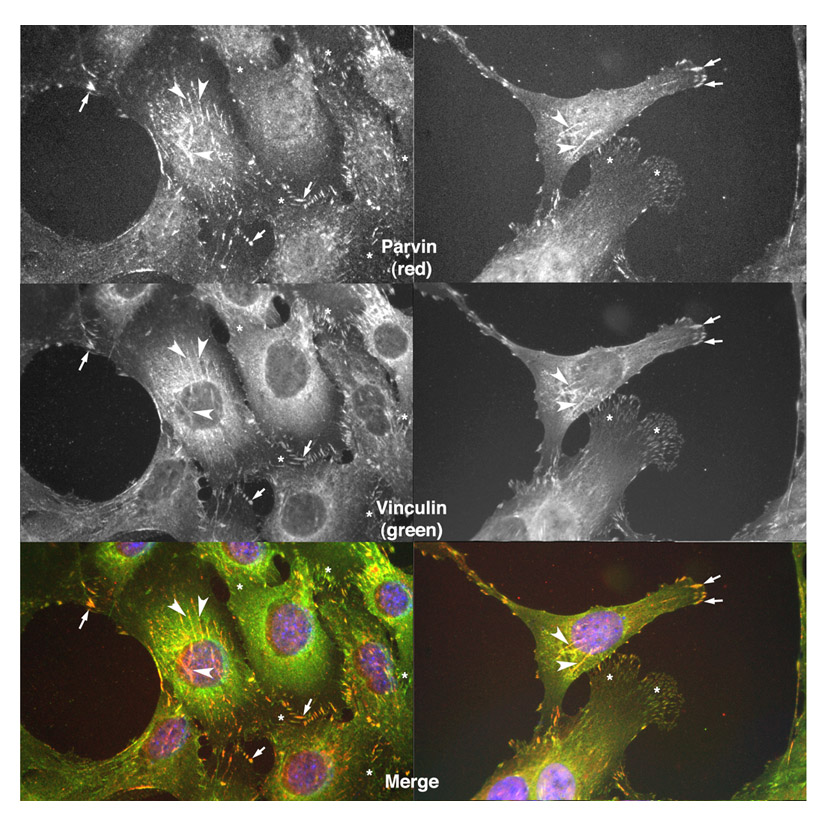
Fig. S5. Localisation of vinculin (green) to fibrillar adhesions in myoblasts as determined by co-localisation with parvin (red). See also images of vinculin and parvin colocalisation to fibrillar adhesions (Olski et al., 2001). Vinculin and parvin are both clearly co-localised in fibrillar adhesions (arrowheads) and focal adhesions (arrows) whereas parvin localises much more weakly to areas containing many small adhesion or focal complexes (asterisks).
Fig. S6. Both vinexin β (A; red in merge), phosphorylated vinexin β (B; red in merge) and exogenously expressed DG-GFP (A,B; green in merge) localised rather weakly to vinculin-containing focal adhesions in H2k myoblasts. GFP alone did not localise at all to vinculin delimited focal adhesions (A,B upper panels). Vinculin blue in all merged images.
Fig. S7. An example of the analysis of different adhesion types based upon size, localisation, and morphological characteristics using vinculin staining as a marker. Focal complexes were classed as small punctate adhesions, 1-5 m2, lying proximal to the cell periphery and at the leading edge of polarised cells (green in merge). Focal adhesions were classed as larger structures 5-20 m2; possessing a more linear morphology with a broader distribution throughout the cell, both at the cell periphery and towards the cell body (red in merge). Fibrillar adhesions were characterised as large, linear structures exceeding 20 m2, and situated nearer to the centre of the cell (blue in merge). Data were curated manually to remove any values over 100 m2 that resulted from areas of ambiguous, or apparently aberrant staining, and to remove conjoined adhesions that could not reliably be classified on size and position alone.