
Figure 7.
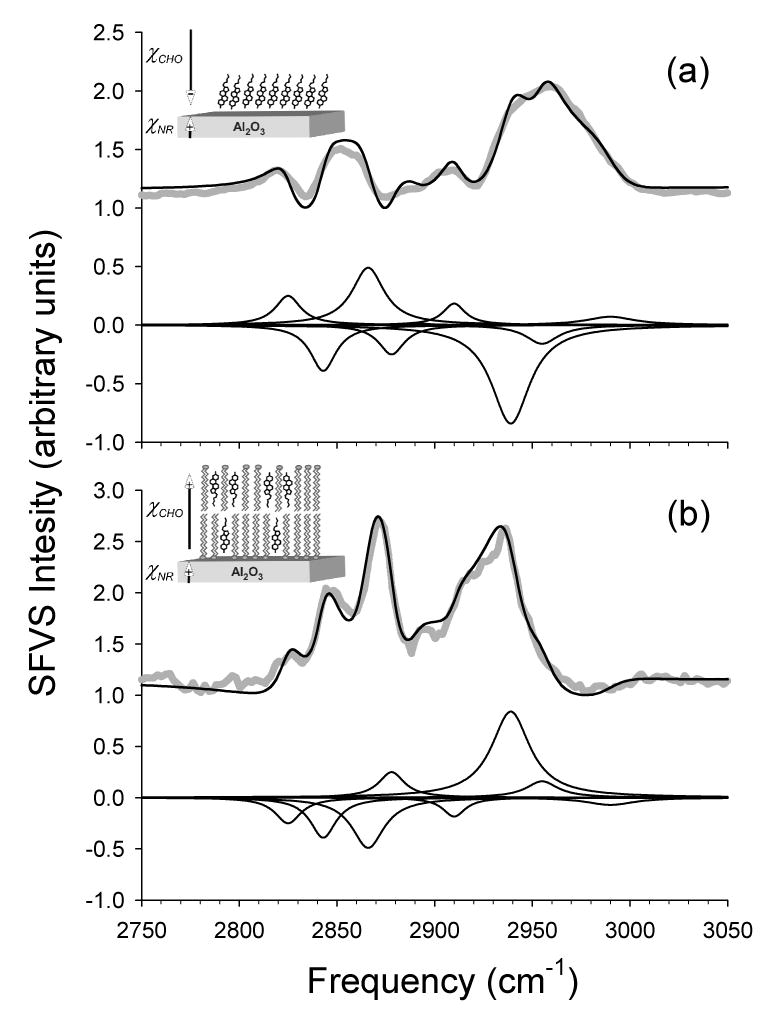
(a) SFVS spectrum of a CHO-d7 monolayer on a sapphire substrate and (b) a spectrum of 60 mol% CHO-d7 in a DSPC-d70 bilayer on sapphire, both shown in gray. Also shown are the spectral fits to the data (solid black lines) and the individual peaks used to obtain the fits which have been offset for clarity. An illustration of the CHO arrangement in a monolayer and bilayer are shown as inserts to (a) and (b) respectively.