Files in this Data Supplement:
Fig. S1. ptc1−/−; lep−/− otic vesicles are the same size as those of siblings at 15S, but smaller and rounder by 25S. (A-H) Merged confocal z-stacks of wild-type and ptc1−/−; lep−/− otic vesicles stained with FITC-phalloidin to mark cortical actin and reveal the morphology of the otic vesicle. Anterior to left, dorsal to top. Scale bars: 50 µm.
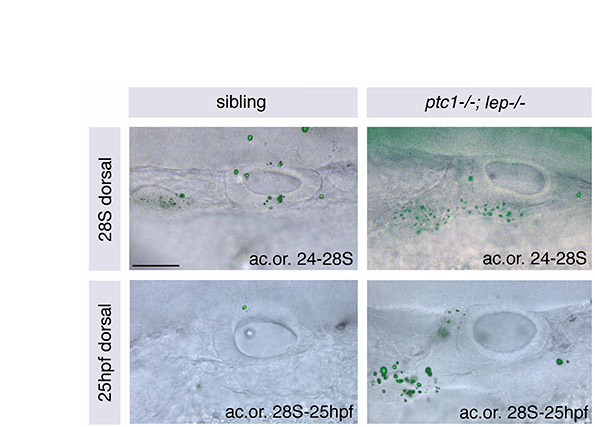
Fig. S2. There is no increase in cell death in DL regions of ptc1−/−; lep−/− otic vesicles compared with those of siblings. Otic vesicles of wild-type and ptc1−/−; lep−/− embryos stained with Acridine Orange (ac.or.) between 24 and 28S (top) and 28S and 25 hpf (bottom) to reveal regions of cell death. Fluorescent images showing Acridine Orange stain are overlaid onto DIC images of live ears. There is no increase in cell death in the ptc1−/−; lep−/− otic vesicle itself. However, there is a significant increase anteroventral and lateral to the otic vesicle, which is likely to include the forming statoacoustic ganglion. Dorsal views; anterior to left, medial to top. Scale bar: 50 µm.
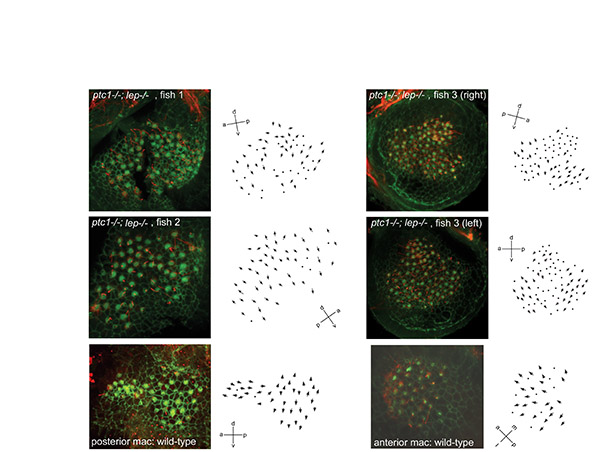
Fig. S3. The single medial macula of ptc1−/−; lep−/− embryos has double posterior character. Merged confocal z-stacks of maculae of 3 dpf ptc1−/−; lep−/− and wild-type embryos stained with FITC-phalloidin (green) to reveal the actin in the stereociliary bundles of the hair cells and with anti-acetylated tubulin antibody (red) to reveal the kinocilia. Arrows show polarity maps for each macula. Hair bundles point away from a midline in both the anterior and posterior halves of the ptc1−/−; lep−/− maculae, resembling the pattern seen in wild-type posterior maculae. a, anterior; d, dorsal; m, medial; mac, macula; l, lateral; p, posterior; v, ventral.
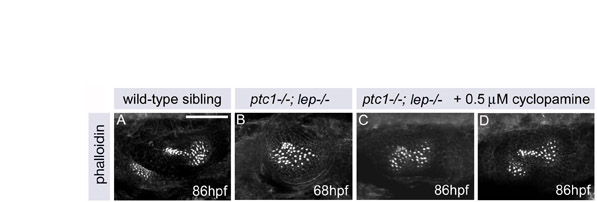
Fig. S4. Low doses of cyclopamine can partially rescue the phenotype of the triangular ptc1−/−; lep−/− medial macula to a �bow tie� shape. (A-D) Merged confocal z-stacks of maculae stained with FITC-phalloidin to reveal the actin-rich stereocilia of the sensory hair cells. Application of 0.5 µM cyclopamine to ptc1−/−; lep−/− embryos rescues the triangular macula phenotype (B) to a �bow-tie� shape (C) resembling that seen in shh-RNA injected embryos. Lateral views; anterior to left, dorsal to top. Scale bar: 50 µm.
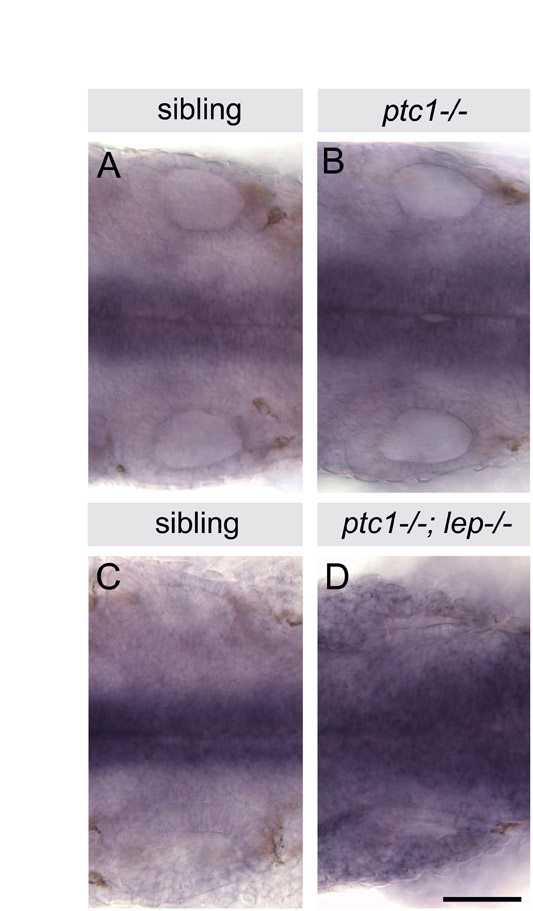
Fig. S5. ptc2 expression is raised in ptc1−/− and ptc1−/−; lep−/− homozygotes. In situ hybridisation for ptc2. Dorsal views of whole-mount 26 hpf embryos, anterior to left, showing the two otic vesicles and midline tissue expressing ptc2. (A,B) Levels of ptc2 expression are slightly raised in ptc1−/− homozygotes compared with sibling embryos. (C,D) Levels of ptc2 are increased considerably in ptc1−/−; lep−/− double homozygotes compared with siblings. The genotype of ptc1−/− embryos was confirmed by PCR. Scale bar: 50 µm.
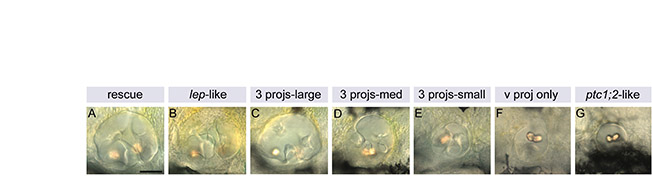
Fig. S6. Phenotypes obtained from application of cyclopamine to ptc1−/−; lep−/− embryos from time points between 17S and 48 hpf. (A-G) Lateral views of live, 80 hpf ears taken using DIC optics. Corresponding data are shown in Table 3. When cyclopamine was applied from 17S, rescue of the ptc1−/−; lep−/− otic phenotype was complete (A). When applied from 48 hpf, the ears remained ptc1−/−; lep−/−-like (G). From time points in between, the later the cyclopamine was applied, the less complete the rescue (B-F). Anterior to left, dorsal to top. Scale bar: 50 µm. 3 projs, all three canal projections present; ptc1;2, ptc1−/−; lep−/−; v proj, only ventral projection present.
Fig. S7. Hedgehog signalling is required before 15S for correct anteroposterior patterning of the zebrafish otic vesicle. (A-F) Merged confocal z-stacks of maculae stained with FITC-phalloidin to reveal the actin-rich stereocilia of the sensory hair cells at 84 hpf. Lateral views: anterior to left, dorsal to top. 50 µM cyclopamine was applied to wild-type (A,B) embryos from the time shown in the grey box until 24 hpf. When cyclopamine was applied from 8-9S, the resulting otic vesicles resembled those of smo−/− (A, 3/6 embryos) or con−/− (B, 3/6 embryos) embryos, which are both severe Hh loss-of-function mutants (Hammond et al., 2003). When cyclopamine was applied from later stages (C-F), the Hh loss-of-function otic phenotypes were not fully phenocopied. Numbers in parentheses in the grey boxes show the proportion of embryos displaying the phenotype shown. Scale bar: 50 µm. am, anterior (utricular) macula; pm, posterior (saccular) macula.