Files in this Data Supplement:
Fig. S1. Scanning electron micrograph of humerus bone from 2 day old mice. The bone was freeze fractured and observed edge-on to the surface, such that the topography profile observed is of an unfractured surface. (A) Continuous topography range from smooth (arrow) to rough (asterisks, Ra∼1 m). (B) Higher magnification of a smooth profile (Ra<50 nm).
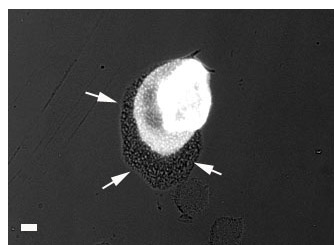
Fig. S2. Transmission light image of an osteoclast on smooth calcite after 30 hours (the same cell shown in Movie S3). Note the local roughening of the surface underneath the cell. The resorption pit is marked by arrows. Scale bar: 10 m.
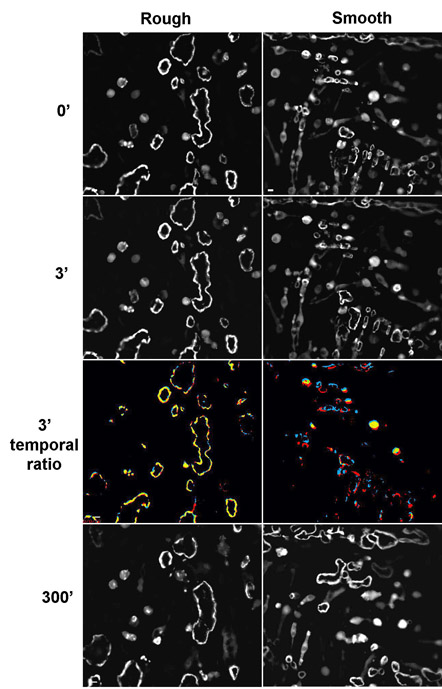
Fig. S3. Frames from a time-lapse movie of sealing zones of several osteoclasts on rough and smooth calcite surfaces after conditioning with 10 g/ml vitronectin, followed by blocking with BSA, and viewed at 0, 3 and 300 minutes. The initial time point is arbitrary. The ratio between two time points, 3 minutes apart, is presented as a color code, such that new pixels are red, pixels that disappeared are blue, and unchanged pixels are yellow. Note that the dynamics, size and number of sealing zone rings are not affected by the treatment. Scale bar: 10 m.
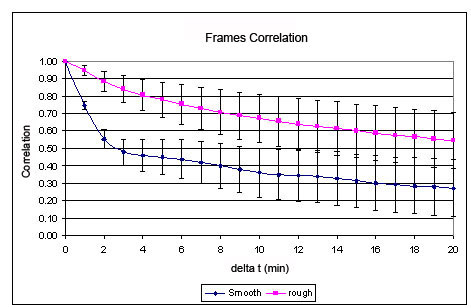
Fig. S4. The correlation between actin distribution in cells cultured on rough or smooth glass surfaces. All frames are from time-lapse movies taken 0-20 minutes apart. The correlation was calculated from time-lapse movies of 15 cells cultured on smooth glass, and 15 cells cultured on rough glass; each movie was 200 minutes long. Error bars represent standard deviation. Notice that the initial decay in correlation on the rough surface is ∼4 times faster than that measured on the smooth surface. Moreover, the correlation between frames taken 10-20 minutes apart on the rough surface is approximately twice as great as that on the smooth surface.
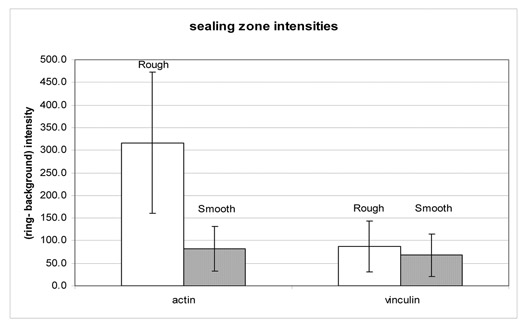
Fig. S5. Sealing zone intensities of actin and vinculin measured on rough and smooth calcite surfaces. The intensity of the background was subtracted from the protein intensity. Error bars represent standard deviation (n=150). Note that while the actin intensity is approximately four times higher on the rough surface than on the smooth surface, vinculin intensity on the two surfaces does not differ significantly.
Movie 1. Time-lapse movie of osteoclast sealing zone rings taken on a rough calcite surface. The frames depicted in Fig. 2 were taken from this movie and Movies 2 and 4. Frequency: 1 frame/minute for 300 minutes. Scale bar: 10 m.
Movie 2. Time-lapse movie of osteoclast sealing zone rings taken a smooth calcite surface. The frames depicted in Fig. 2 were taken from this movie and Movies 1 and 4. Frequency: 1 frame/minute for 300 minutes. Scale bar: 10 m.
Movie 3. Time-lapse movie of a single ring taken on a smooth calcite surface, 30 hours after replating. Note the size and stability of the sealing zone ring, due to roughening of the surface underneath the cell (see supplementary material Fig. S1). Frequency: 1 frame/minute for 400 minutes. Scale bar: 10 m.
Movie 4. Time-lapse movie of osteoclast sealing zone rings taken on a step on smooth calcite. The frames depicted in Fig. 2 were taken from this movie and Movies 1 and 2. Frequency: 1 frame/minute for 300 minutes. Scale bar: 10 m.
Movie 5. A 3-minute temporal ratio movie of an osteoclast sealing zone on a step on smooth calcite (the same cell that appears in Fig. 2). The ratio is presented as a color code, such that new pixels are red, pixels that disappeared are blue, and unchanged pixels are yellow. At first, the dominant colors are red and blue, but with time and with the increase in ring size, yellow pixels predominate, demonstrating the correlation between increasing resorption around the imperfection, and sealing zone size and stability. Scale bar: 10 m.
Movie 6. Time-lapse movie of osteoclast sealing zone rings taken on a rough calcite surface. Treatment with nocodazole after 10 minutes is labeled in the movie. Note that prior to treatment, there was one stable ring; following such treatment, small, unstable rings started to appear. Frequency: 1 frame/minute for 840 minutes. Scale bar: 10 m.