Files in this Data Supplement:
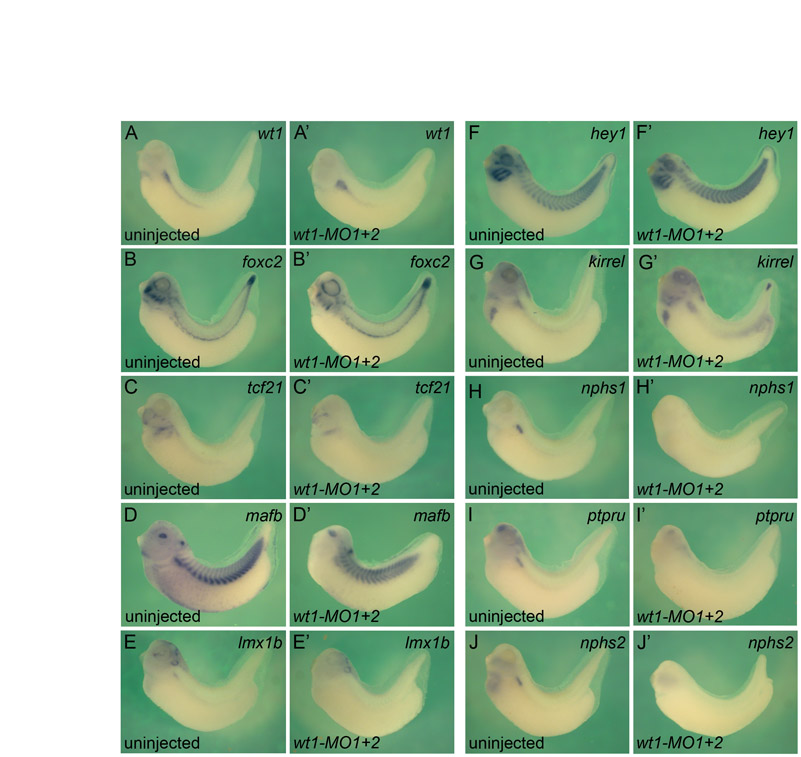
Fig. S1. wt1 regulates podocyte gene expression. Whole-mount in situ hybridization comparing the expression of podocyte genes wt1 (A,A′), foxc2 (B,B′), tcf21 (C,C′), mafb (D,D′), lmx1b (E,E′), hey1 (F,F′), kirrel (G,G′), nphs1 (H,H′), ptpru (I,I′) and nphs2 (J,J′) between Xenopus embryos injected with wt1-MO1+2 and sibling control embryos at stage 35.
Fig. S2. Elimination of one pseudo-allele of wt1. (A-I′) Close-ups of representative transverse sections of whole-mount in situ hybridization comparing the expression of podocyte genes wt1 (A,A′), tcf21 (B,B′), lmx1b (C,C′), mafb (D,D′), foxc2 (E,E′), ptpru (F,F′), nphs1 (G,G′), kirrel (H,H′) and nphs2 (I,I′) between embryos injected with wt1-MO1 and sibling control embryos at stage 35. (J-L) Whole-mount in situ hybridization of nphs1 in an uninjected control (J), an embryo injected with wt1-MO1 (K) and injected with wt1* mRNA and wt1-MO1 (L).
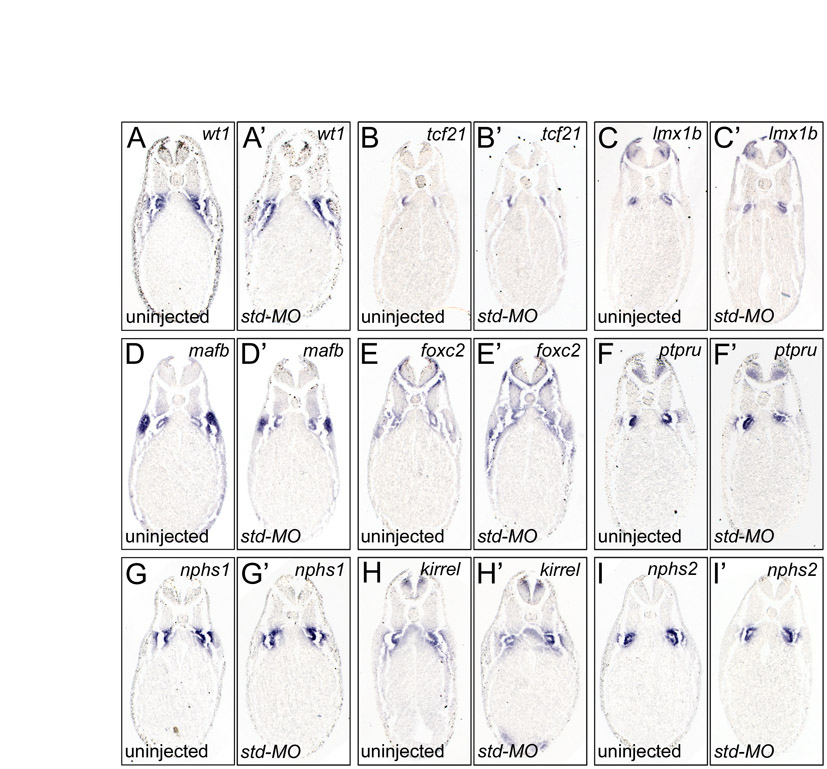
Fig. S3. Injection of the standard control antisense morpholino oligomer (Std-MO) does not affect podocyte gene expression. Representative transverse sections of whole-mount in situ hybridization comparing the expression of podocyte genes wt1 (A,A′), tcf21 (B,B′), lmx1b (C,C′), mafb (D,D′), foxc2 (E,E′), ptpru (F,F′), nphs1 (G,G′), kirrel (H,H′) and nphs2 (I,I′) between Std-MO-injected and sibling embryos at stage 35.
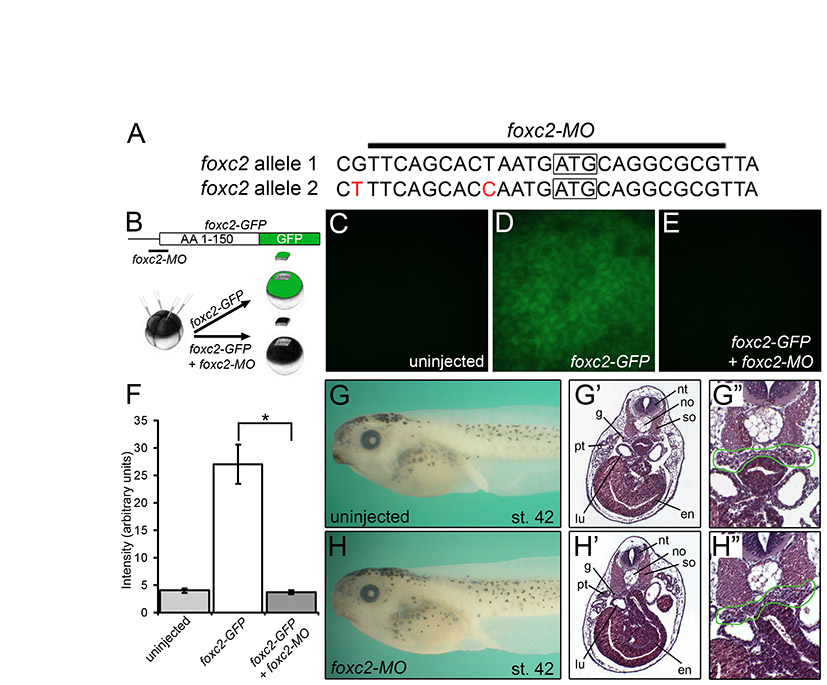
Fig. S4. Glomus phenotype caused by knockdown of foxc2. (A) Sequences of the two pseudo-alleles of foxc2 and the location of the foxc2-MO; mismatches between the two pseudo-alleles of foxc2 are indicated in red; the translational start site is boxed. (B) Schematic of the GFP-reporter assay. (C-E) Fluorescence of animal poles dissected from uninjected control embryos (C) or embryos injected with the foxc2-GFP reporter mRNA (D) or co-injected with foxc2-MO and the foxc2-GFP reporter (E) at stage 10. (F) Quantification of fluorescence intensity over multiple experiments (*P<0.0001). (G-H′) Phenotype and histology of foxc2-MO-injected embryos (H,H′) and sibling controls (G,G′) at stage 42. The glomus is outlined in green in the magnified images to the right. en, endoderm; g, glomus; lu, lung; no, notochord; nt, neural tube; pt, pronephric tubules; so, somites.
Fig. S5. foxc2 regulates podocyte gene expression. (A-I′) Representative transverse sections of whole-mount in situ hybridization comparing the expression of podocyte genes wt1 (A,A′), tcf21 (B,B′), lmx1b (C,C′), mafb (D,D′), foxc2 (E,E′), ptpru (F,F′), nphs1 (G,G′), kirrel (H,H′) and nphs2 (I,I′) between foxc2 morphants and sibling control embryos at stage 35. (J) Wire diagram summarizing the in situ hybridization data. Note that none of the interactions is necessarily direct and might involve intermediary players. (K-L) In situ hybridization of kirrel in uninjected controls (K), embryos injected with foxc2-MO (K′) and injected with 500 pg foxc2* mRNA and foxc2-MO (K′′). Multiple experiments were analyzed and the results summarized (L). Black, strong bilateral expression; white, loss of expression; gray, unilateral expression rescued by foxc2* mRNA.
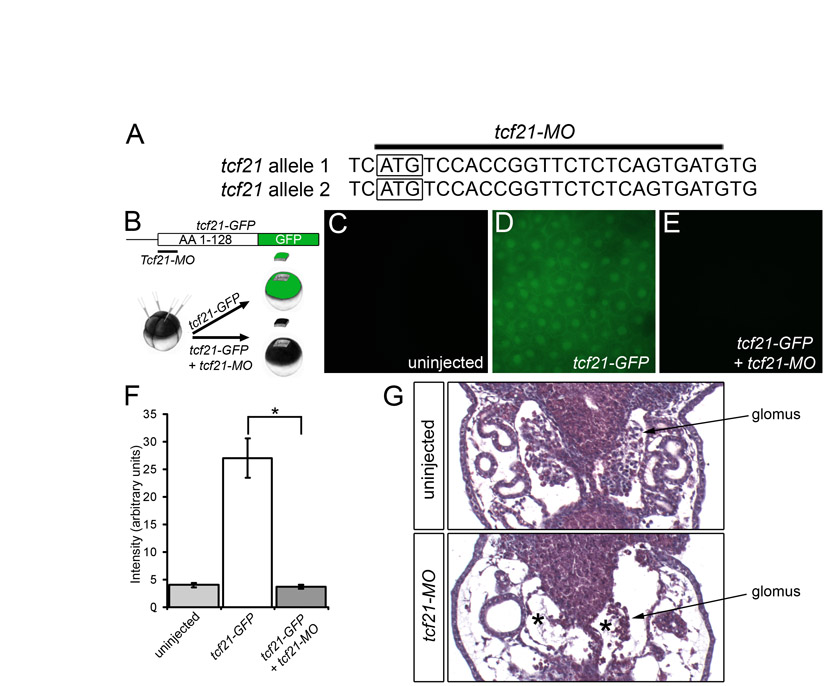
Fig. S6. Glomus phenotype in tcf21 knockdowns. (A) Sequences of the two pseudo-alleles of tcf21 and the location of the tcf21-MO; the translational start site is boxed. (B) Schematic of the GFP-reporter assay. (C-E) Fluorescence of animal poles dissected from uninjected control embryos (C) or embryos injected with the tcf21-GFP reporter mRNA (D) or co-injected with tcf21-MO and the tcf21-GFP reporter (E) at stage 10. (F) Quantification of fluorescence intensity over multiple experiments (*P<0.05). (G) Histology of tcf21-MO-injected embryos and sibling controls at stage 42. Asterisks indicate the enlarged capillary loops present in the tcf21 morphants.
Fig. S7. The role of tcf21 in podocyte development. (A-I′) Representative transverse sections of whole-mount in situ hybridization comparing the expression of podocyte genes wt1 (A,A′), tcf21 (B,B′), lmx1b (C,C′), mafb (D,D′), foxc2 (E,E′), ptpru (F,F′), nphs1 (G,G′), kirrel (H,H′) and nphs2 (I,I′) between tcf21 morphants and sibling control embryos at stage 35. (J) Wire diagram summarizing the in situ hybridization data. Note that none of the interactions is necessarily direct and might involve intermediary players.
Fig. S8. Knockdown phenotype of lmx1b. (A) Sequences of the two pseudo-alleles of lmx1b and the location of the lmx1b-MO; the translational start site is boxed. (B) Schematic of the GFP-reporter assay. (C-E) Fluorescence of animal poles dissected from uninjected control embryos (C) or embryos injected with the lmx1b-GFP reporter mRNA (D) or co-injected with lmx1b-MO and the lmx1b-GFP reporter (E) at stage 10. (F) Quantification of fluorescence intensity over multiple experiments (*P<0.0001). (G) Histology of lmx1b-MO-injected embryos and sibling controls at stage 42.
Fig. S9. The role of lmx1b in podocyte development. (A-I′) Representative transverse sections of whole-mount in situ hybridization comparing the expression of podocyte genes wt1 (A,A′), tcf21 (B,B′), lmx1b (C,C′), mafb (D,D′), foxc2 (E,E′), ptpru (F,F′), nphs1 (G,G′), kirrel (H,H′) and nphs2 (I,I′) between lmx1b morphants and sibling control embryos at stage 35. (J) Wire diagram summarizing the in situ hybridization data. Note that none of the interactions is necessarily direct and might involve intermediary players. (K-L) In situ hybridization of mafb in uninjected controls (K), embryos injected with lmx1b-MO (K′) and injected with 250 pg lmx1b* mRNA and lmx1b-MO (K′′). Multiple experiments were analyzed and the results are summarized (L). Black, strong bilateral expression; white, loss of expression; gray, unilateral expression rescued by lmx1b* mRNA.
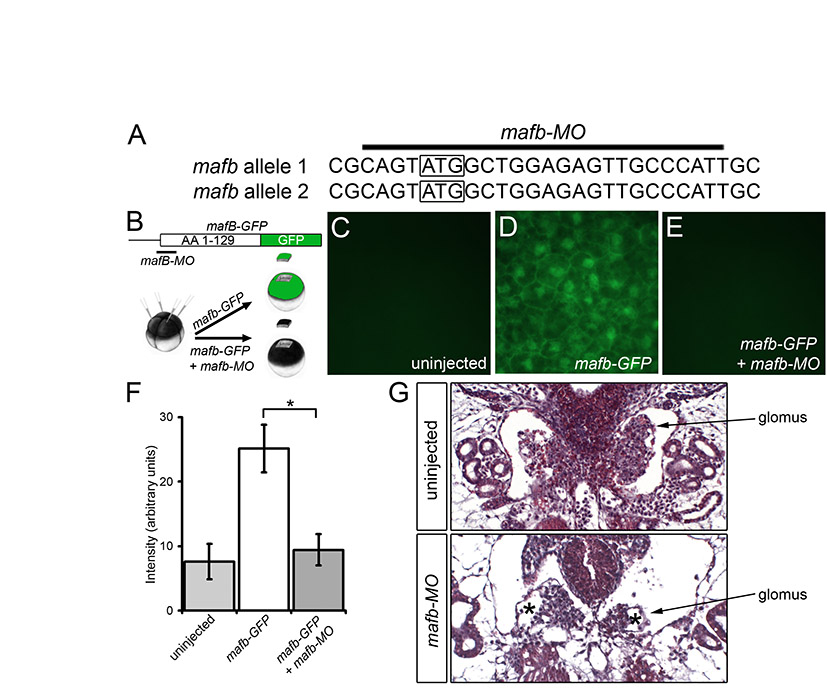
Fig. S10. Knockdown of mafb results in a reduced glomus. (A) Sequences of the two pseudo-alleles of mafb and the location of the mafb-MO; the translational start site is boxed. (B) Schematic of the GFP-reporter assay. (C-E) Fluorescence of animal poles dissected from uninjected control embryos (C) or embryos injected with the mafb-GFP reporter mRNA (D) or co-injected with mafb-MO and the mafb-GFP reporter (E) at stage 10. (F) Quantification of fluorescence intensity over multiple experiments (*P<0.05). (G) Histology of mafb-MO-injected embryos and sibling controls at stage 42. Asterisks indicate the enlarged capillary loops present in mafb morphants.
Fig. S11. The role of mafb in podocyte development. (A-I′) Representative transverse sections of whole-mount in situ hybridization comparing the expression of podocyte genes wt1 (A,A′), tcf21 (B,B′), lmx1b (C,C′), mafb (D,D′), foxc2 (E,E′), ptpru (F,F′), nphs1 (G,G′), kirrel (H,H′) and nphs2 (I,I′) between mafb morphants and sibling control embryos at stage 35. (J) Wire diagram summarizing the in situ hybridization data. Note that none of the interactions is necessarily direct and might involve intermediary players. (K-L) In situ hybridization of nphs2 in uninjected controls (K), embryos injected with mafb-MO (K′) and injected with 500 pg mafb* mRNA and mafb-MO (K′′). Multiple experiments were analyzed and the results are summarized (L). Black, strong bilateral expression; white, loss of expression; gray, unilateral expression rescued by mafb* mRNA.
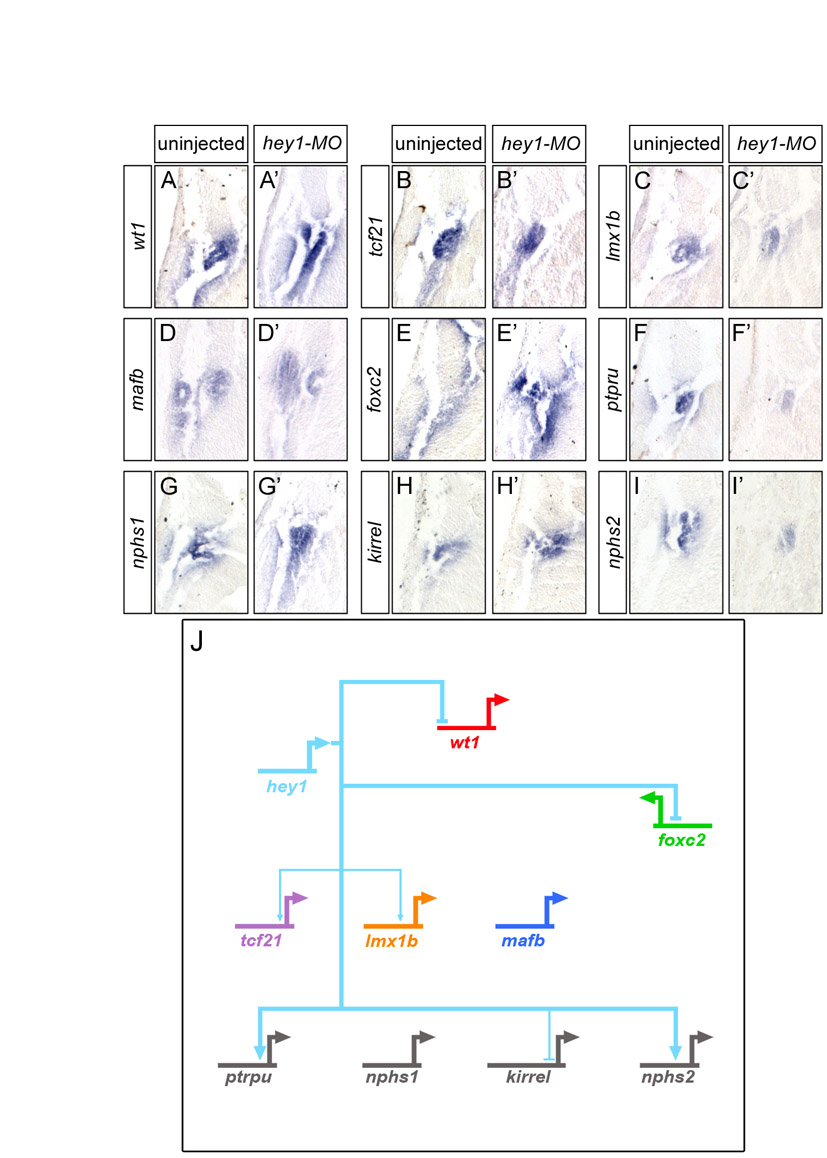
Fig. S12. The role of hey1 in podocyte development. (A-I′) Close-ups of transverse sections of whole-mount in situ hybridizations comparing the expression of podocyte genes wt1 (A,A′), tcf21 (B,B′), lmx1b (C,C′), mafb (D,D′), foxc2 (E,E′), ptpru (F,F′), nphs1 (G,G′), kirrel (H,H′) and nphs2 (I,I′) between hey1-MO-injected embryos and sibling controls at stage 35. (J) Wire diagram summarizing the in situ hybridization data. Note that none of the interactions is necessarily direct and might involve intermediary players.
Fig. S13. Podocyte gene expression in ectodermal and mesodermal explants. (A) RT-PCR analysis of whole control embryos (lane 1), control ectodermal explants (lane 2), ectodermal explants treated with 10 ng/ml Activin A for 3 hours at stage 9.5 (lane 3) and ectodermal explants injected with wt1*/foxc2* mRNA (lane 4), comparing the expression of podocyte terminal differentiation genes. Note that Activin A treatment was sufficient to induce podocyte differentiation, whereas wt1*/foxc2* mRNA was not. (B) RT-PCR analysis of whole control embryos (lane 1), control ventral marginal zones (lane 2), and ventral marginal zones injected with wt1*/foxc2* mRNA (lane 3). (C) RT-PCR analysis of control ventral marginal zones and ventral marginal zones injected with wt1*/foxc2*, NICD, wt1*/NICD, foxc2*/NICD and wt1*/foxc2*/NICD mRNA. Data were quantified and corrected for equal loading by odc1. AC, animal cap; VMZ, ventral marginal zone; WE, whole control sibling embryo. EF-1α served as a loading control, α-Actin as a marker for mesoderm contamination.