Files in this Data Supplement:
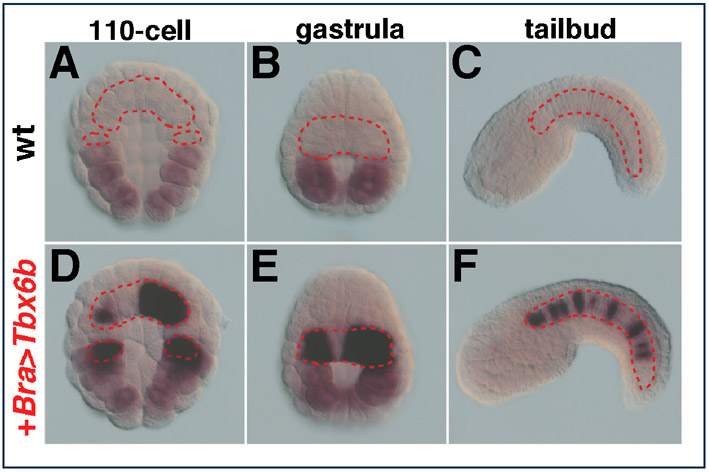
Fig. S1. Ci-Tbx6b is efficiently expressed in Ciona notochord cells by the Ci-Bra promoter region. (A-C) Whole-mount control Ciona embryos fixed at the stages indicated above each panel and hybridized in situ with a Ci-Tbx6b digoxigenin-labeled antisense RNA probe. (D-F) Embryos electroporated at the one-cell stage with the Bra>Tbx6b construct, then fixed at the stages indicated above each panel and hybridized in situ with the Ci-Tbx6b probe. Wild-type (wt) embryos show expression of Ci-Tbx6b in muscle precursors at the 110-cell and gastrula stage (A,B), but not at the tailbud stage (C), consistent with previous results (Takatori et al., 2004). Embryos electroporated with the Bra>Tbx6b construct expressed Ci-Tbx6b in both the tail muscle (the endogenous gene) and the notochord (the transgene) at the 110-cell and at the gastrula stage (D,E), whereas at the tailbud stage, only the notochord expression directed by the transgene was detected (F). In all panels, the notochord and its precursors are outlined by a dashed red line. Note that not all the notochord cells show staining, because of mosaic incorporation of the transgene. Embryos were photographed after addition of small amounts of 80% glycerol.
Fig. S2. Identification of the minimal sequences required for the activity of the Ci-Tbx6b CRM in Ciona muscle cells. (A) Schematic representation of the Ci-Tbx6c/Ci-Tbx6b genomic locus according to the JGI Ciona intestinalis genome browser (Dehal et al., 2002; http://genome.jgi-psf.org/Cioin2/Cioin2.home.html). Blue boxes and dashed lines indicate exons and introns, respectively. The yellow bar depicts the 2.4 kb genomic fragment that was cloned and analyzed. (B) Truncation analysis of the 2.4 kb fragment. The shaded region indicates the minimal sequence sufficient to direct expression in muscle cells in a heterologous context (i.e. upstream of the Ci-FoxA-a basal promoter, pink bar). Selected constructs were also attached to the endogenous Ci-Tbx6b basal promoter (yellow small bar) and assayed for activity. The presence and intensity of the muscle staining produced by each construct are noted to the right (see explanation below). (C) A representative mid-tailbud embryo which was electroporated with the 2.4 kb Ci-Tbx6b fragment at the one-cell stage, then fixed and stained with X-Gal at the mid-tailbud stage. Orange and purple arrowheads indicate muscle and mesenchyme cells, respectively. Anterior is on the left, dorsal on top. (D,E) Low-magnification microphotographs of Ciona intestinalis embryos electroporated with either the 2.4 kb Ci-Tbx6b CRM (D) or the Ci-Tbx6b basal promoter (E). Embryos representative of our empirical ‘+’ and ‘−’ ranking system are highlighted. (F) Graph of a representative experiment reporting the percentage of embryos showing staining in muscle (orange columns) and in mesenchyme (grey columns) when electroporated with either the 2.4 kb Ci-Tbx6b CRM (left), the Ci-Tbx6b basal promoter (center), and the empty pFBΔSP6 vector, containing the FoxA-a basal promoter (right).
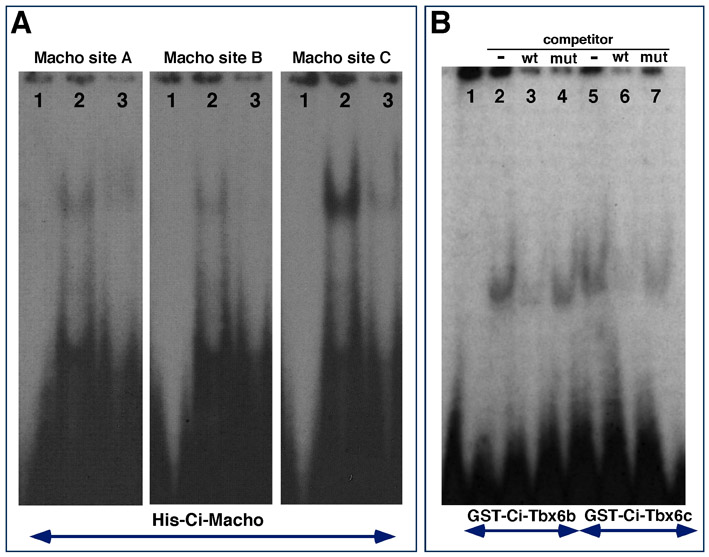
Fig. S3. In vitro binding of the sequences required for early and late muscle activity of the Ciona Tbx6b CRM by Ci- Ci-Macho1, Ci-Tbx6b and Ci-Tbx6c. (A) Electrophoretic mobility-shift assays (EMSA) with radiolabeled probes containing the three putative Macho1 binding sites (see Fig. 2A) and a His-Ci-Macho1 fusion protein. Lanes contained: (1) free radiolabeled probes containing each of the three putative Macho1 binding sites; (2) radiolabeled probes incubated with the His-Ci-Macho1 fusion protein; (3) the complexes described in 2, incubated with the unlabeled oligonucleotides at 5 M final concentration (competitors). (B) EMSA with a radiolabeled probe containing the T-box binding site incubated with either the GST-Ci-Tbx6b (lanes 2-4) or the GST-Ci-Tbx6c (lanes 5-7) fusion protein. Lanes contained: (1) free radiolabeled probe containing the T-box site; (2) radiolabeled probe incubated with the GST-Ci-Tbx6b fusion protein; (3-4) the complex described in 2 incubated with unlabeled wild-type (wt) (3) and a mutant competitor where the T-box site has been ablated (4), at 5 M final concentration. (5) Radiolabeled probe incubated with the GST-Ci-Tbx6c fusion protein; (6-7) the complex described in 5 incubated with unlabeled wild-type (wt) (6) and mutant competitor (7).
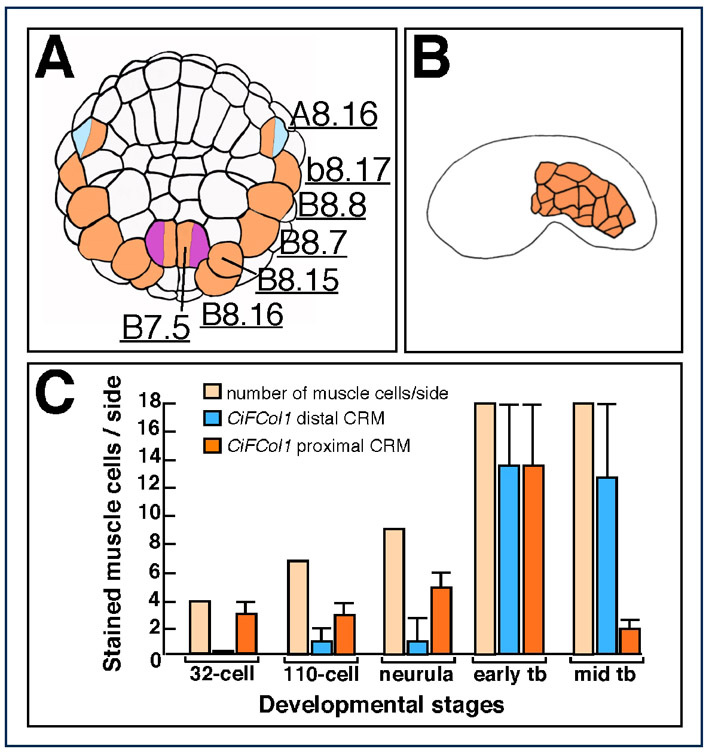
Fig. S4. Differential temporal activity of the Ciona FCol1 muscle CRMs. (A,B) Simplified schematic representations of the muscle precursors in a 110-cell Ciona embryo (A, dorsal-vegetal view) and of the 18 muscle cells per side that they give rise to in an early tailbud embryo (B, lateral view). In A, the blastomeres that will give rise also to cells of the CNS are colored in blue and orange (A8.16), and those that will give rise also to mesenchyme cells and trunk ventral cells are colored in purple and orange (B7.5 pair). In B, only the muscle cells of the tailbud are shown. Adapted from published results (Satoh, 1994). (C) Activity of the distal (blue columns) and proximal (orange columns) CiFCol1 CRMs in muscle cells was determined at consecutive developmental stages by counting the cells stained in each positive embryo, taking into account mosaic incorporation of the plasmids. The average number of positive cells found in at least 50% of the scored embryos was plotted against the number of muscle cells (beige columns), which is invariant.