Files in this Data Supplement:
Fig. S1. Glutathione can directly reduce PrxIV peroxidatic disulphides in vitro. Purified PrxIV C51A (12.5 M) was incubated for 30 minutes at 37°C in the presence or absence of 1 mM reduced glutathione in 50 mM HEPES pH 7. Free thiols were alkylated using 40 mM NEM and 3 g each sample analysed by non-reducing SDS-PAGE. Untreated protein was also included under reducing conditions.
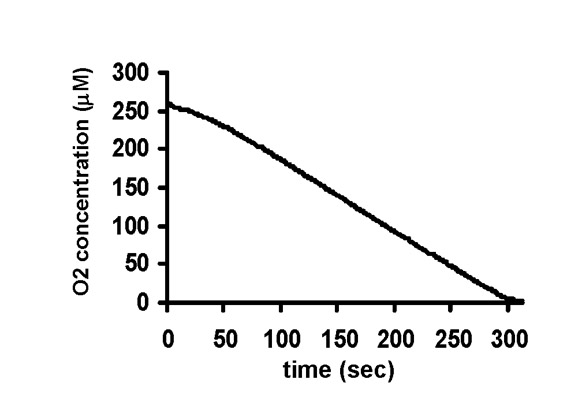
Fig. S2. DTT is a substrate for human Ero1α in vitro. Purified Ero1α (0.5 M) was assayed for activity by oxygen consumption in the presence of 12.5 mM DTT.
Fig. S3. PrxIV hyperoxidation in HT1080 cells treated with DTT. Quantification of PrxIV hyperoxidation represented in Fig. 5A. Intensity of PrxIV-SO2/3 in the absence of DTT was assigned an arbitrary value of 1 and all other values calculated relative to this. All values are adjusted relative to the corresponding tubulin loading control, data show the means of two experiments with error bars representing s.d.
Fig. S4. Overexpressed PrxIV is sensitive to oxidation following DTT treatment. Western blot analysis of Prx hyperoxidation following treatment of PrxIV-overexpressing cells with increasing concentrations of DTT for 5 minutes at 37°C. PrxIV is indicated (*) and tubulin provides a loading control. Lanes 1-5 were probed with the antibody to hyperoxidised Prx, whereas lane 6 was probed with anti-PrxIV.
Fig. S5. BiP is not upregulated during induced expression of Ero1α. (A) Anti-Ero1α western blot analysis of lysates from HEK TREX Ero1α-V5 cells incubated for 16 hours in the absence or presence of doxycyclin. Induced expression of Ero1α-V5 far exceeds levels of endogenous Ero1α, indicated with asterisk. (B) Samples generated and analysed for Fig. 5E were also used for anti-BiP western blotting with lysate from cells treated with 5 g/ml tunicamycin for 24 hours as a positive control for BiP upregulation.
Fig. S6. DTT-induced PrxIV hyperoxidation significantly increases with Ero1α overexpression. Quantification of PrxIV hyperoxidation represented in Fig. 5D. Intensity of PrxIV-SO2/3 in the absence of DTT was assigned an arbitrary value of 1 for both induced and uninduced cells. Values for each DTT treatment were then calculated relative to these. All values are adjusted relative to the corresponding tubulin loading control; data show the means of three datasets with error bars representing s.d. Statistical significance of differences between the responses at each DTT concentration was calculated using a two-tailed, unpaired t-test assuming unequal variance between samples.
Fig. S7. PrxIV hyperoxidation significantly increases with overexpression of deregulated Ero1α. Quantification of PrxIV hyperoxidation represented in Fig. 5E. Intensity of PrxIV-SO2/3 in each uninduced cell line was assigned an arbitrary value of 1. The PrxIV-SO2/3 intensity following doxycyclin treatment was then calculated relative to this for each cell line. For the ‘WT’ cell line the DTT treated sample was also expressed relative to the untreated control. All values are adjusted relative to the corresponding tubulin loading control; data show the means of three datasets with error bars representing standard deviation. Statistical significance of the difference between the two cell-lines was calculated using a two-tailed, unpaired t-test assuming unequal variance between samples.