Blood, Vol. 114, Issue 13, 2783-2792, September 24, 2009
The Duffy-null state is associated with a survival advantage in leukopenic HIV-infected persons of African ancestry
Blood Kulkarni et al. 114: 2783
Supplemental materials for: Kulkarni et al
Files in this Data Supplement:
- Table S1. Characteristics of the study subjects (PDF, 17 KB)
- Figure S1. Mixed effects models of WBC counts during disease according to racial/ethnic groups and DARC −46C/C genotype (JPG, 129 KB) -
Panel A shows the time-trends of WBC counts during disease. The lines represent the predicted trajectories of the WBC counts estimated using generalized linear mixed models. Time zero represents the WBC count at diagnosis. The red, blue and black lines represent subjects who are African American, European American and from other racial groups, respectively. Panel B shows time-trends of WBC counts during disease of African American subjects with (pink line) and without (green line) the DARC −46C/C genotype. N, number of subjects. M, number of WBC observations.
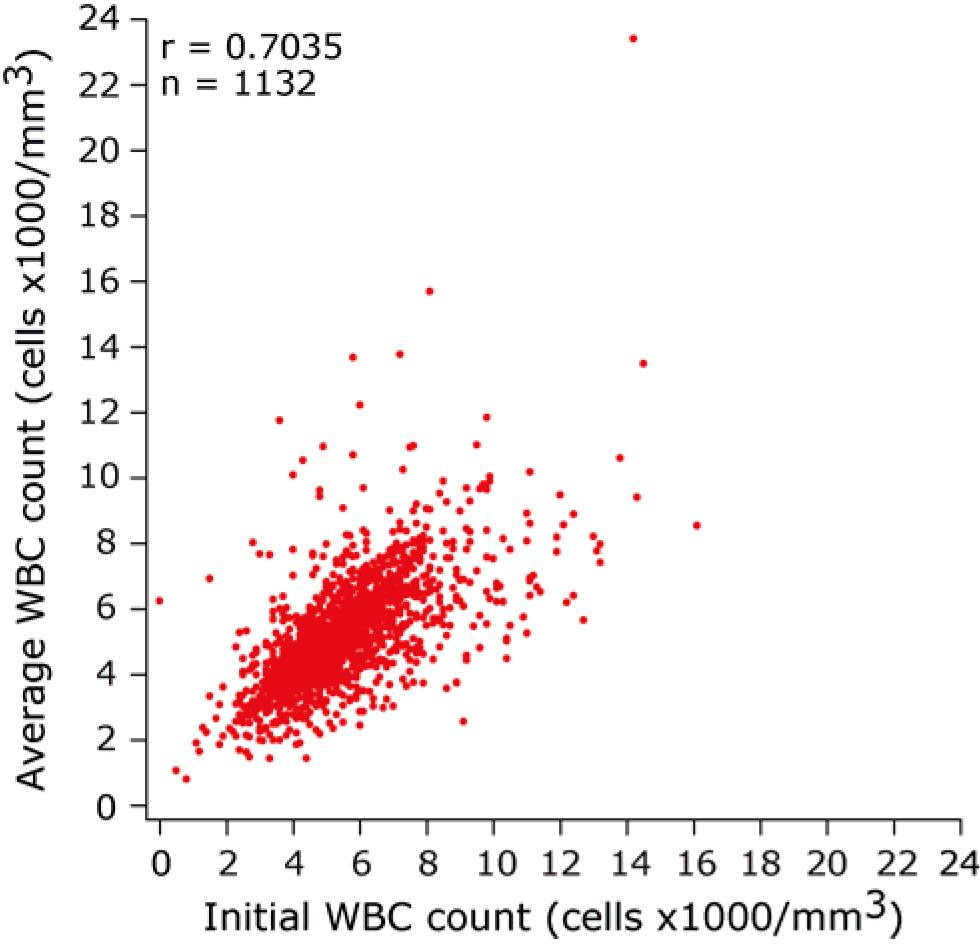
- Figure S2. Spearman’s correlation (r) between WBC counts at diagnosis and during disease for all HIV-positive subjects in the cohort (JPG, 99.2 KB) -
- Figure S3. Initial WBC counts at diagnosis according to race/ethnicity and DARC −46C/C genotype (JPG, 130 KB) -
Panels A show box-and-whisker plots depicting the distribution of the initial WBC at diagnosis in the major ethnic groups represented in the study population. AA, African Americans; EA, European Americans; OT, other ethnicities. Numbers at the top are p-values obtained by Mann-Whiney tests for the indicated comparisons. N, number of subjects. In panel B, the bar charts depict the mean (vertical bars) and 95% confidence intervals (error bars) for the initial WBC counts at diagnosis in the indicated racial/ethnic groups according to their DARC T-46C genotype. Numbers at the top are p-values obtained by Mann-Whiney tests for the indicated comparisons. N, number of subjects *, too few subjects (1 EA and 3 others) for whom the vertical bars are not shown.
- Figure S4. Differential effects of low WBC counts on HIV disease course in HIV-infected EA and AA (JPG, 172 KB) -
KM plots depict survival curves computed according to race/ethnicity and average WBC count in the entire cohort (A), and seroconverting (B) and seroprevalent (C) component of the cohort. Low indicates subjects belonging to the lowest tertile of the ethnic-specific average WBC count (3 for AA and 3 for EA) whereas high refers to the middle and upper ethnic-specific tertile of average WBC counts. RH, relative hazards (reference RH = 1 represents AAs with WBC counts of ≥4000 cells/mm3); CI, confidence interval; P, significance values obtained by Cox proportional hazards modeling.
- Figure S5. Rate of HIV disease progression in Duffy-null (DARC −46C/C) and Duffy-positive AA subjects and EAs (JPG, 202 KB) -
Each panel shows KM survival plots for three groups of HIV-infected subjects: EA (blue), AAs possessing DARC −46C/C (pink) and AAs possessing DARC −46 C/T or T/T genotype (green). The KM plots are for those with baseline CD4+ T-cell counts of 3 in the entire cohort (top row), and the seroconverting (middle row) and seroprevalent (bottom row) component of the cohort. P, significance value obtained by logrank test.