Combined Optical and X-ray Tomosynthesis Breast Imaging
© RSNA, 2010
Appendix E1 (PDF)
Supplemental Figures

Figure E1: Photograph of the combined optical and DBT imaging system.

Figure E2: Close-up view of the probe setup.
a. | b. |

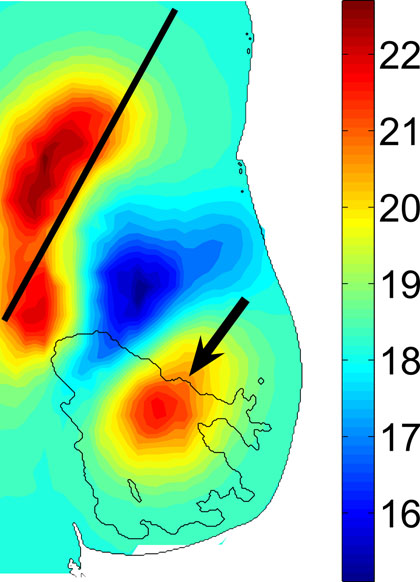
Figure E3: Reconstructed (a) DBT and (b) HbT images of a 2-cm invasive ductal carcinoma (arrow) in a 68-year-old woman. Dashed line on a and solid line on b correspond to the boundary of the chest wall muscle.
a. | b. |

Figure E4: Reconstructed (a) DBT and (b) HbT images of a 2.2-cm invasive ductal carcinoma (arrow) in a 42-year-old woman.
a. | b. |


Figure E5: Reconstructed (a) DBT and (b) HbT images of a 0.6-cm invasive ductal carcinoma (arrow) in a 77-year-old woman. Dashed line on a and solid line on b correspond to the boundary of the chest wall muscle.
a. | 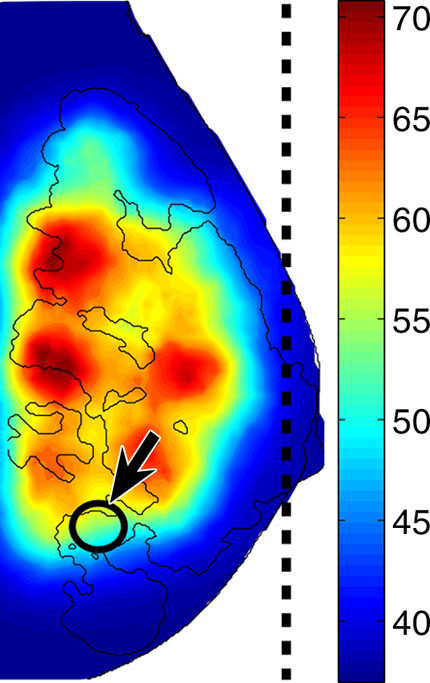 b. |

Figure E6: Reconstructed (a) DBT and (b) HbT images of an 8-mm fibroadenoma (arrow on a, arrow with circle on b) in a 42-year-old woman. Dashed line on b denotes the maximum extent of the optical field of view.
a. | b. |


Figure E7: Reconstructed (a) DBT and (b) HbT images of two large cysts that were 29 × 11 × 26 mm and 12 × 9 × 5 mm, respectively (arrows on a,arrows withcircles on b) in a 49-year-old woman. Dashed line on b denotes the maximum extent of the optical field of view.