Magnetization Transfer Helps Detect Intestinal Fibrosis in an Animal Model of Crohn Disease
© RSNA, 2011
Supplemental Figures

Figure E1: Dot plot shows tissue collagen content in the late phase (21–28 days after laparotomy). Rats injected with PG-PS (n = 14) developed greater tissue levels of type I collagen than did those injected with HSA (n = 5) (experiments 1–3; see Table 1 in article). The mean collagen content (hatched lines) was 1404.6 DU ± 179.9 for rats injected with PG-PS and 319.4 DU ± 22.4 for those injected with HSA (P = .003).
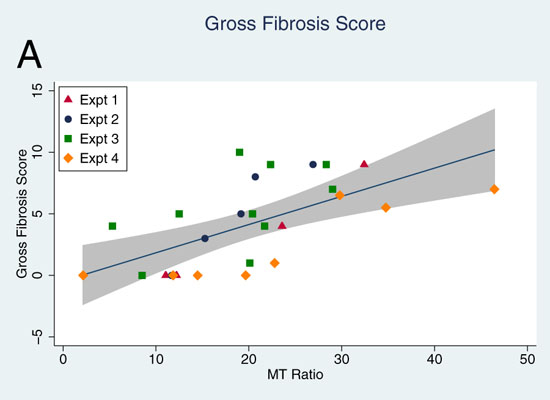
Figure E2: Graph shows correlation of MT ratio with multiple measurements of fibrosis in rats injected with PG-PS and HSA across the four experiments (see Table 1 in article). A, Gross fibrosis score, a composite score of cecal wall thickening, mesenteric thickening, and adhesions, shows correlation with the MT ratio (n = 35, ρ = 0.63, P = .0001). Expt = experiment. B, Tissue thickness, a surrogate indicator of tissue fibrosis, shows correlation with the MT ratio (n = 19; R = 0.55, P = .02). The gray area on graphs represents the prediction from a linear regression of the y variable on the x variable with 95% confidence interval as calculated with the statistical software package.

Figure E3: Graph shows relationship between MT ratio and histologic inflammation. The MT ratio showed weak correlation with tissue inflammation in the early inflammatory phase in rats injected with PG-PS and HSA (n = 16, ρ = 0.48, P = .06). The gray area represents the prediction from a linear regression of the y variable on the x variable with 95% confidence interval as calculated with the statistical software package.
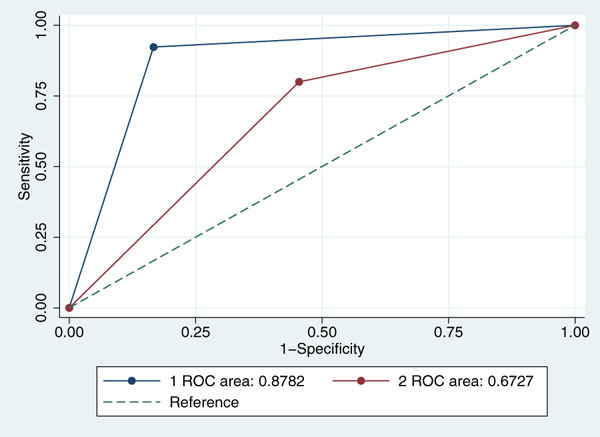
Figure E4: Receiver operating characteristic (ROC) curves for the prediction of fibrosis with the MT ratio and two measures of fibrosis: collagen content measured with Western blot analysis (curve 1) and histologic fibrosis score (curve 2).
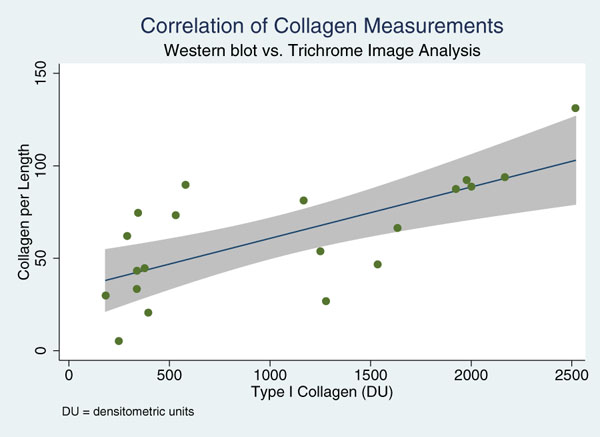
Figure E5: Graph shows correlation of collagen content measured with trichrome image analysis and Western blot analysis. Colorimetric image analysis of Masson trichrome-stained cecal tissue was routinely performed with MatLab software in rats in which tissue collagen measurements were available. An area of blue pixels was standardized by dividing area measurement by tissue length measured along the axis of the muscularis propria, excluding plicae. Standardized collagen area determined with MatLab trichrome colorimetric analysis correlated with tissue collagen determined with Western blot for type I collagen (n = 20, R = 0.69, P = .0007). The gray area represents the prediction from a linear regression of the y variable on the x variable with 95% confidence interval as calculated with the statistical software package.
Supplemental Tables
Table E1. Correlation of MT Ratio and Fibrosis as Determined with Collagen Content at Western Blot Analysis

* Fibrosis was diagnosed if the tissue collagen score at Western blot analysis was at least 500 DU.
Table E2. Correlation of MT Ratio and Fibrosis as Determined with Histologic Fibrosis Score

* Fibrosis was diagnosed if the histologic fibrosis score was at least 2.
Table E3. Number of Rats Studied to Evaluate Late Fibrosis

* One image was unreadable.