Effect of vascular endothelial growth factor and its receptor KDR on the transendothelial migration and local trafficking of human T cells in vitro and in vivo
Supplemental materials for: Edelbauer et al
Files in this Data Supplement:
- Document 1. Supplemental materials and methods (PDF, 90 KB)
- Figure S1. Intensity of KDR expression on endothelial cells (JPG, 819 KB) -
(A) and (B) illustrate the expression of KDR on endothelial cells by FACS (A) and by confocal microscopy (B). Expression of KDR is intense and diffuse on CD31+ endothelial cells (unactivated) compared with mitogen activated T cells (illustrated in Fig. 1).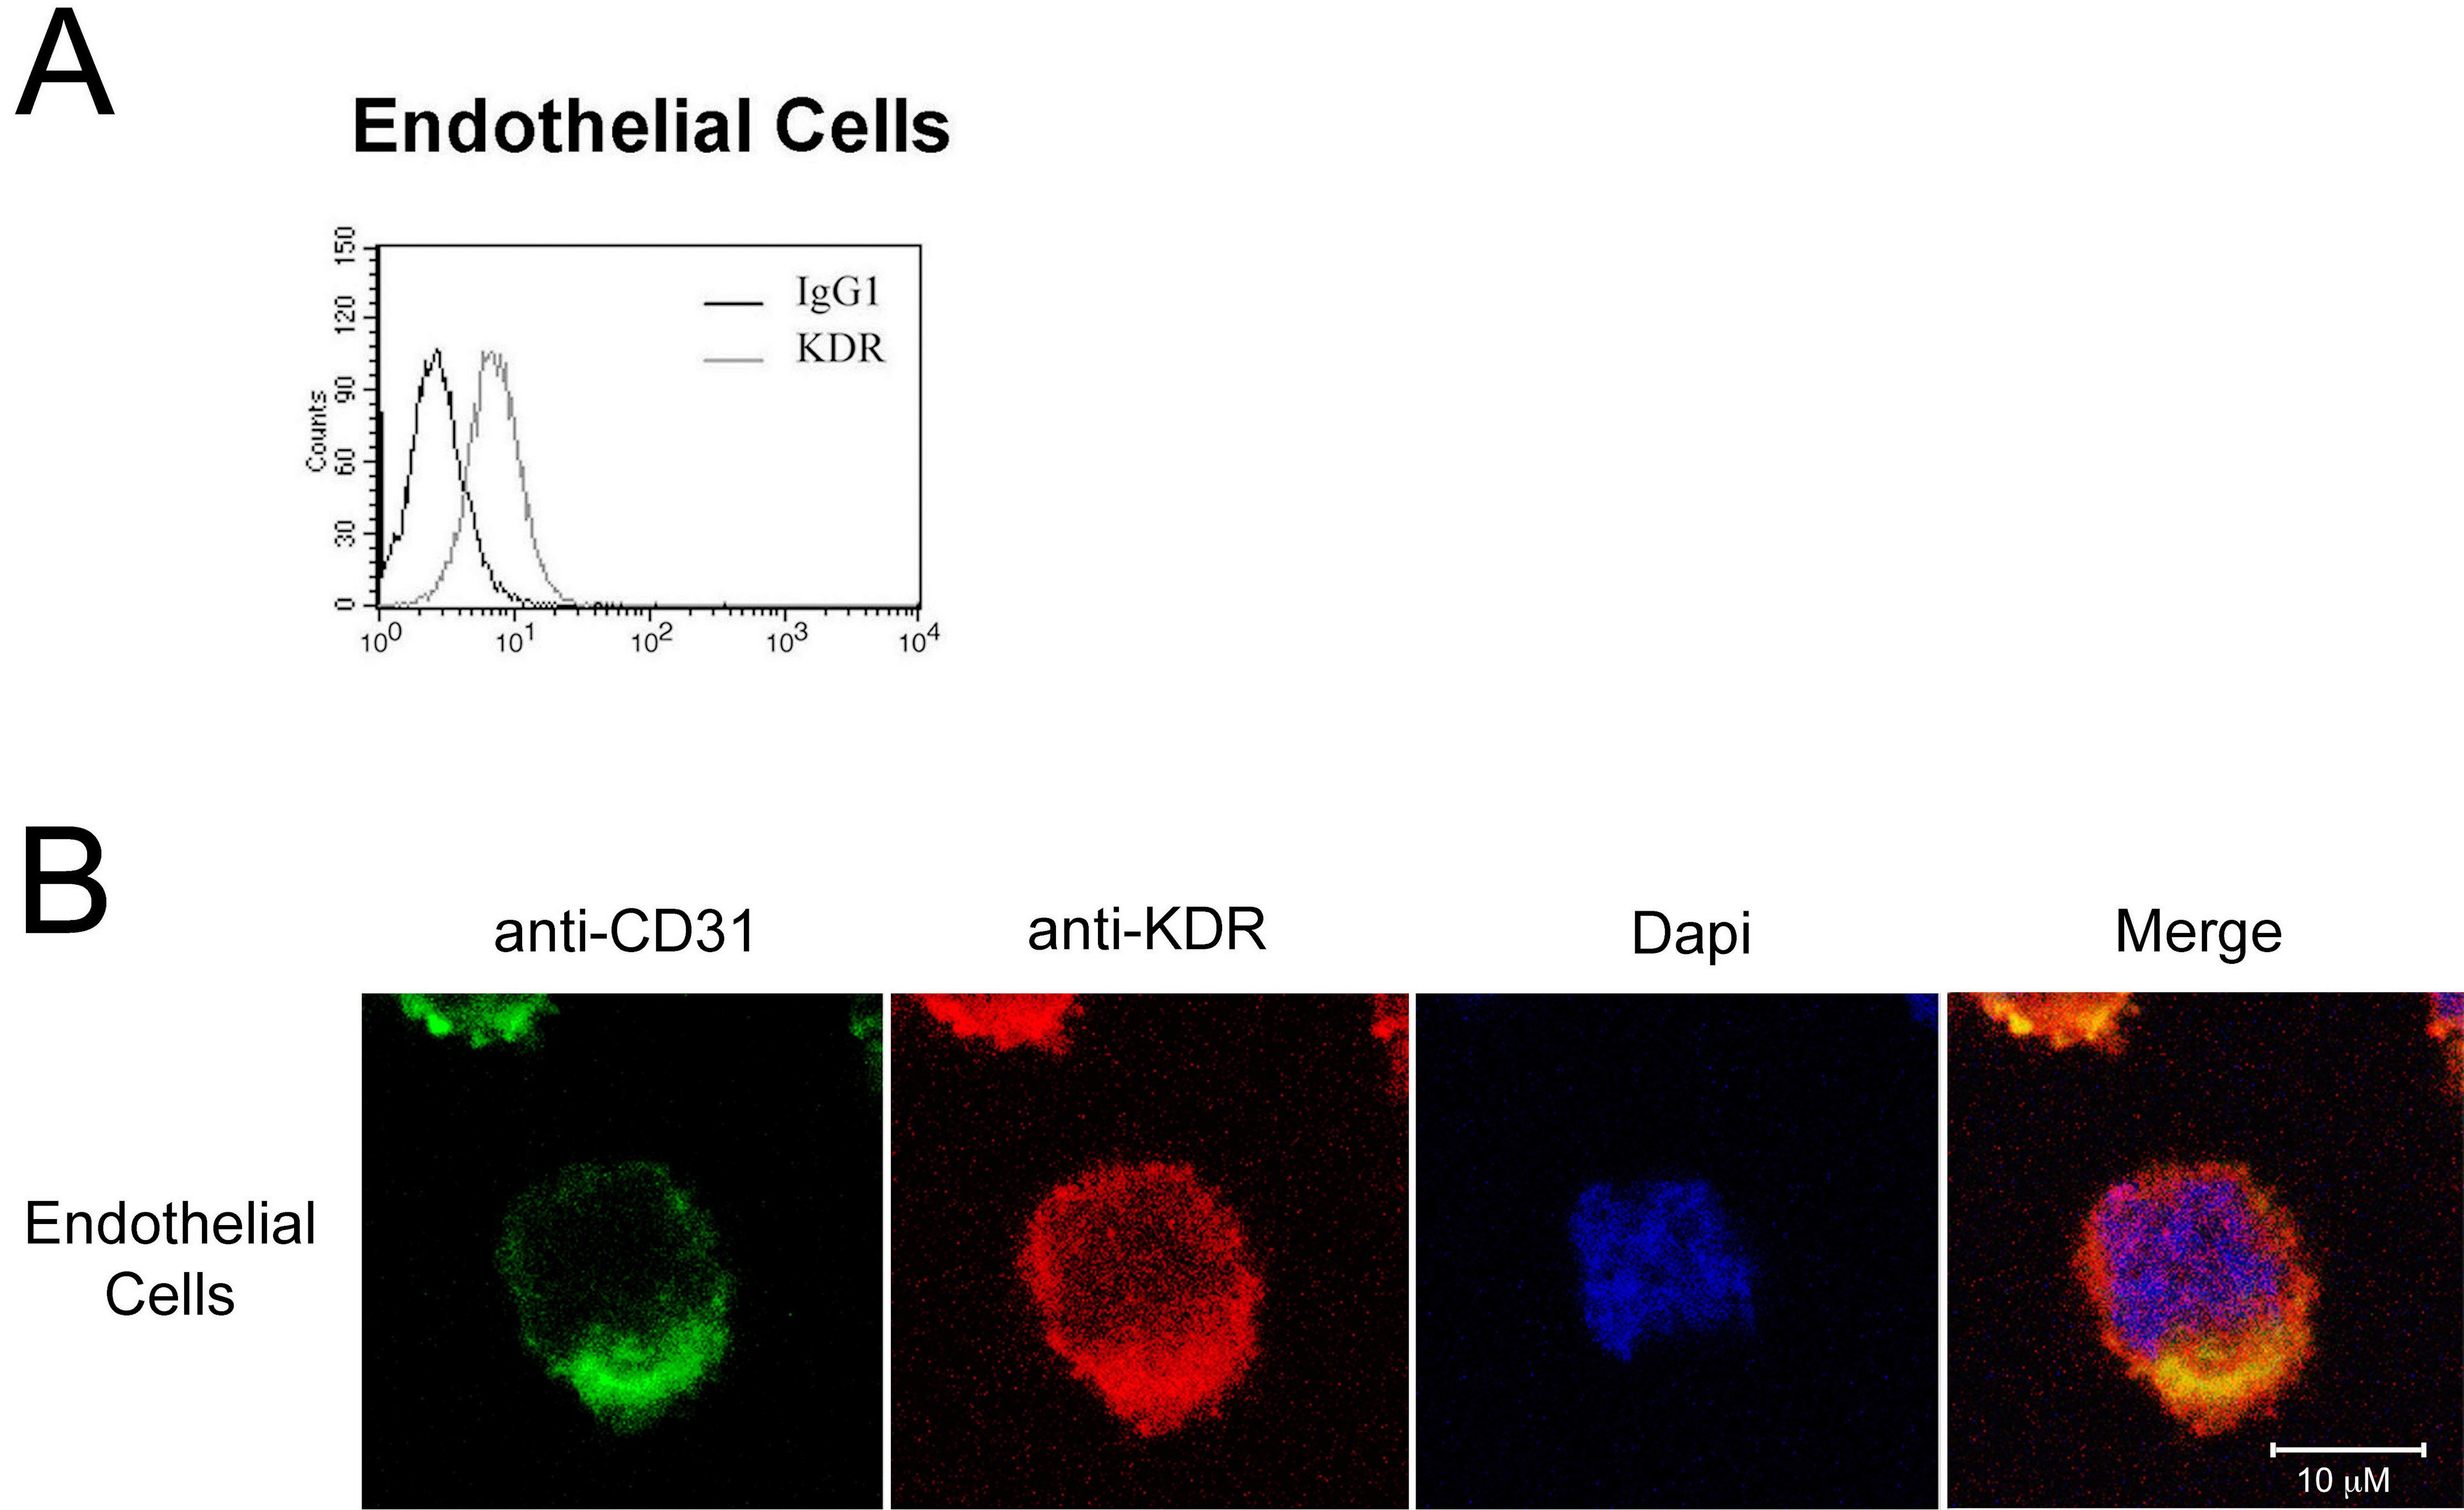
- Figure S2. Expression of KDR within human allografts (JPG, 720 KB) -
(A) Immunofluorescence staining of KDR and CD3 in human endomyocardial biopsies in the absence of rejection. (B�C) Immunofluorescence staining of KDR and CD3 in kidney allograft biopsies with evidence of rejection. Merged images illustrate co-expression of KDR and CD3 (yellow color) on focal infiltrates within each biopsy (B) and (C) are from two different renal transplant recipients. A similar pattern of staining was found in cardiac allografts with evidence of rejection (illustrated in Fig. 2).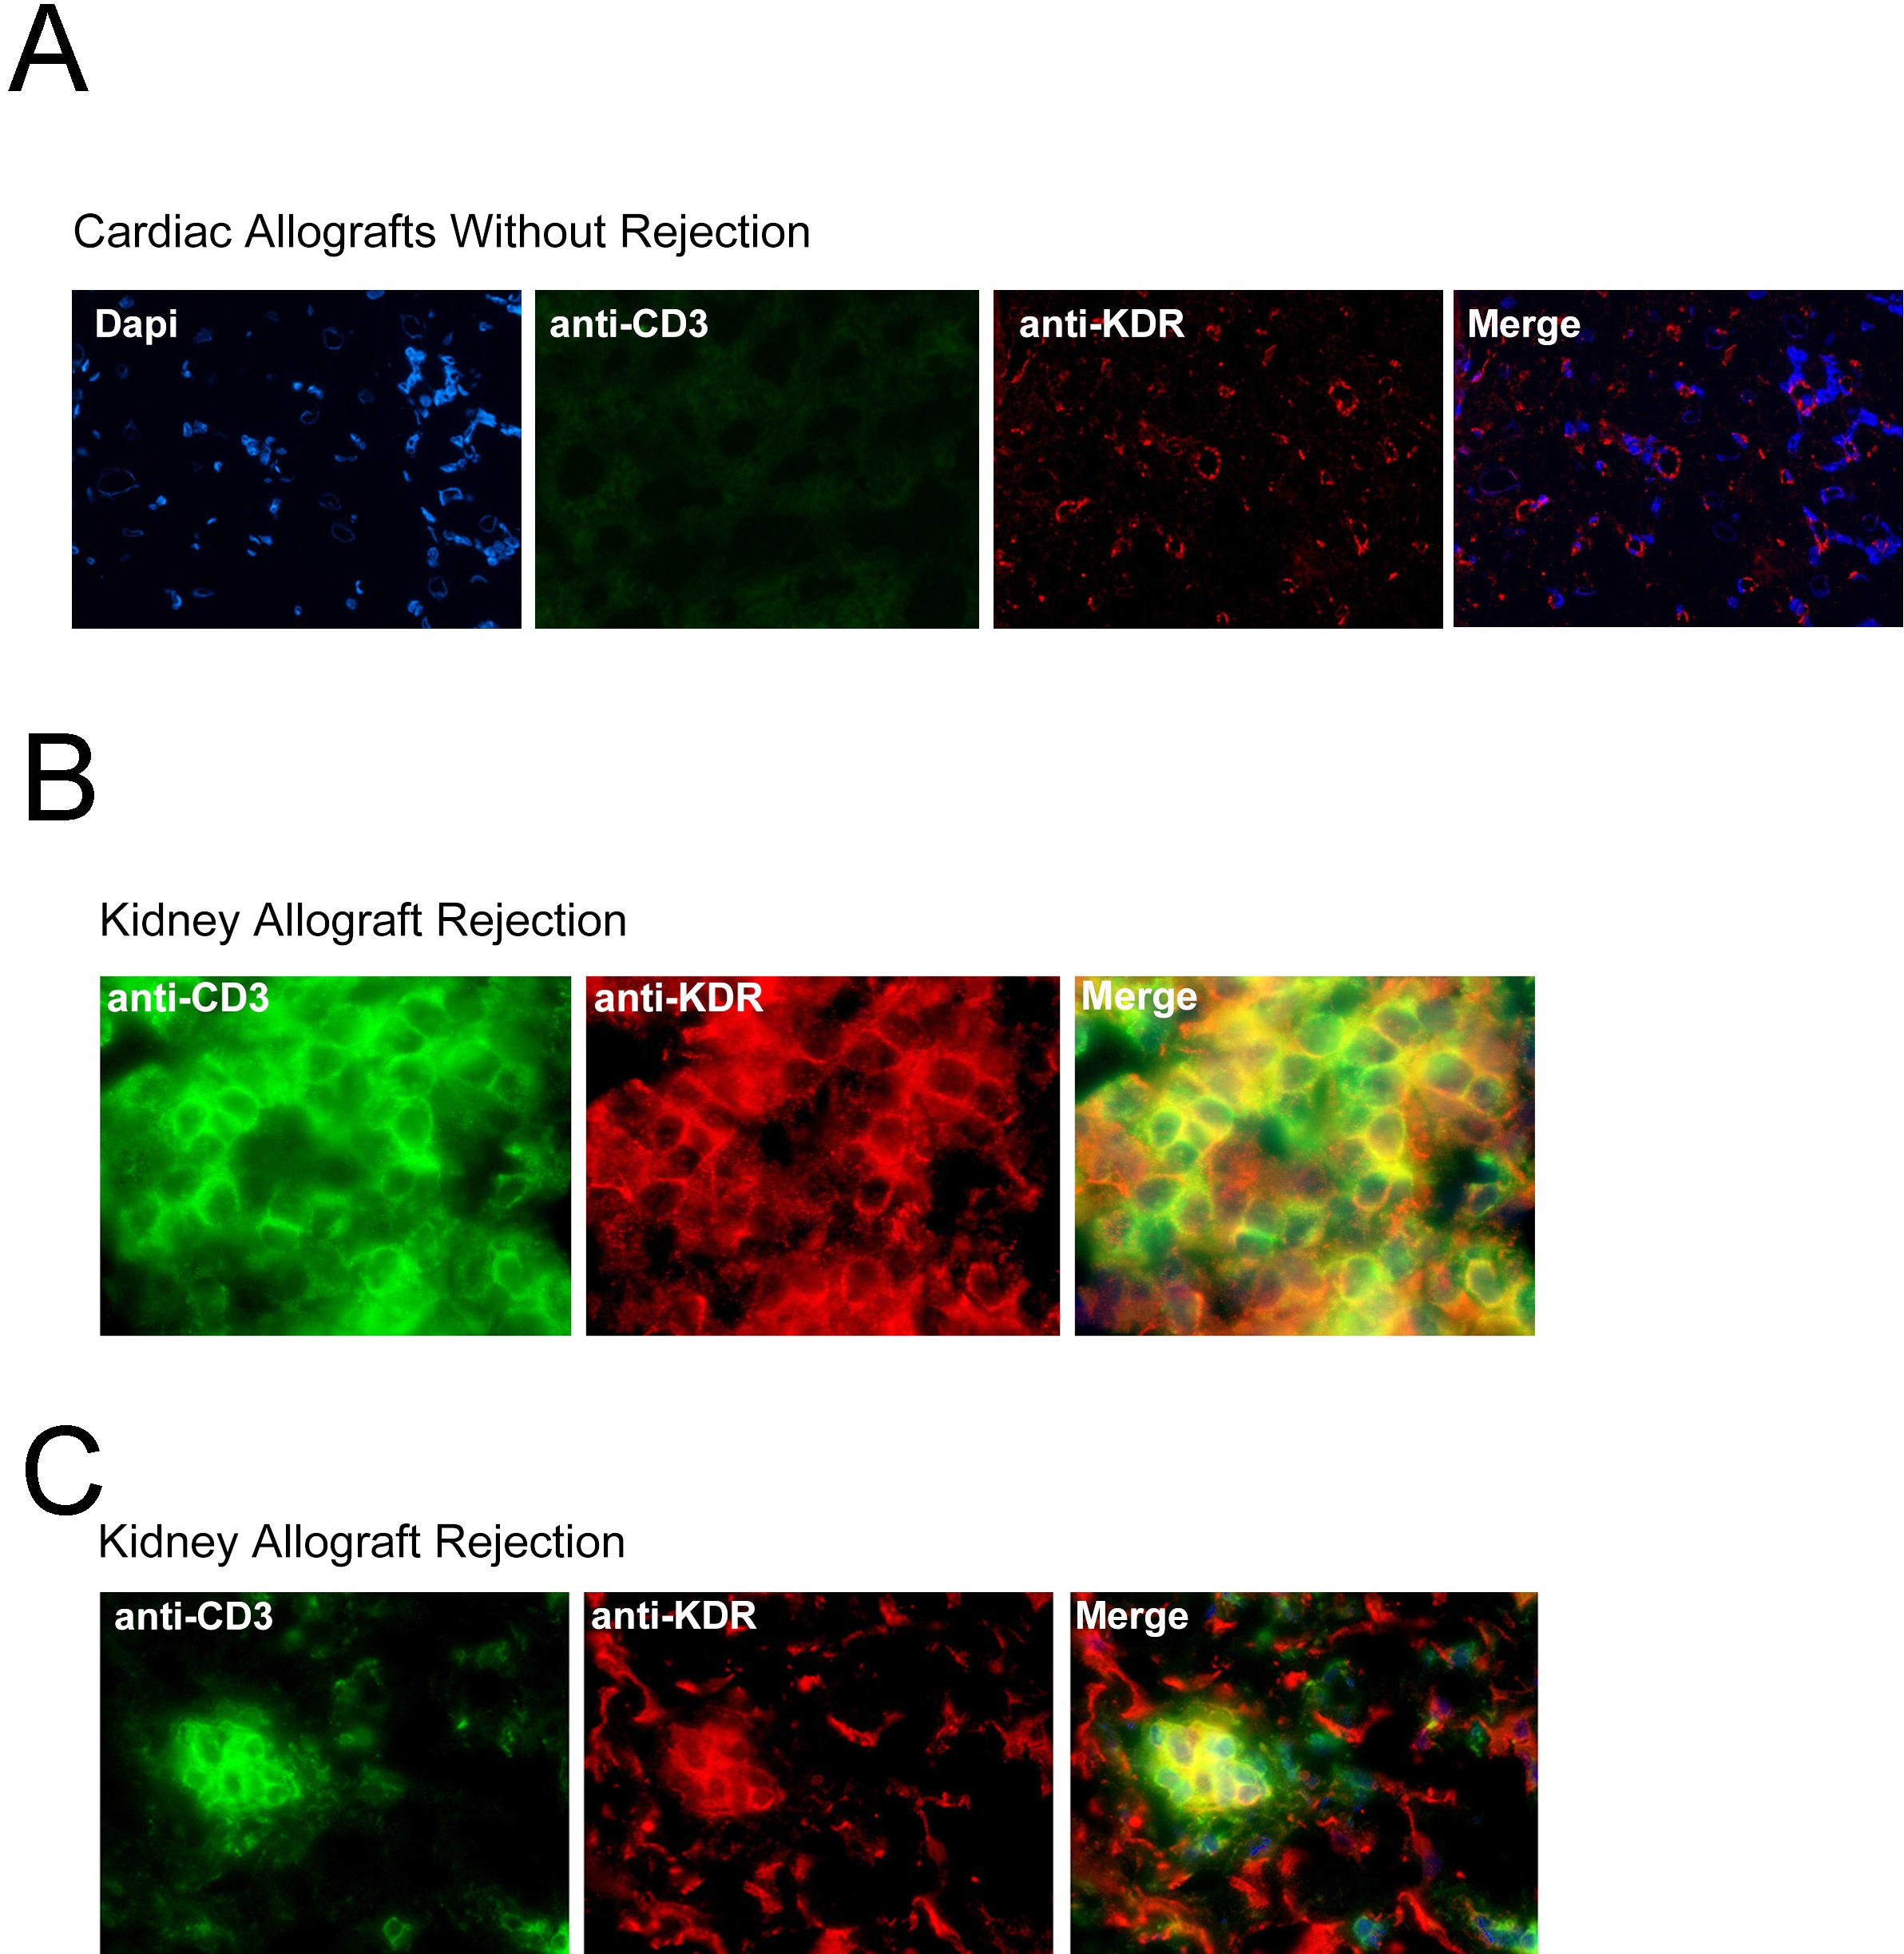
- Figure S3. Induced expression of KDR on T cells following transendothelial migration (JPG, 770 KB) -
Endothelial cells were cultured to confluency on 3 µm pore membranes in FluroBlok™ transwells. Subsequently, T cells were added into the upper chamber and were allowed to migrate into the lower chamber for 12 hours. T cells were harvested from the upper and lower chambers and analyzed for the expression of KDR by FACS. Basal levels of KDR expression on CD4+ and CD8+ T cells are illustrated in Fig. 6. (A�B) representative expression of KDR on CD4+ and CD8+ T cells harvested from the upper chamber after 12 hrs. (C�F) representative FACS plots following transmigration of CD4+ T cells (Panels C�D) or CD8+ T cells (Panels E�F) across untreated or TNF-α�activated endothelial cells, as indicated. (G�H) Isotype control antibody staining of the cells shown in (D) and (F). The illustrated data are representative of n=5 for each experimental group.