Contrast-enhanced MR Angiography of the Abdomen with Highly Accelerated Acquisition Techniques
© RSNA, 2011
Appendix E1
Determination of the level of acceleration (R) necessary for the targeted two-part protocol is illustrated in Table E1. It was assumed at the outset that a coronal format 3D Fourier transform acquisition would be used, with frequency encoding in the superoinferior direction, phase encoding left to right, and section encoding anterior to posterior. Typical values for the FOV, as used in the in vivo studies, are shown in the table. For the test bolus acquisition the primary goal was to depict progressive arterial filling with a targeted frame time of approximately 1.0 second. Assuming that view sharing is done, then the temporal footprint (13), or time required for one complete image, was allowed to be several times longer, here chosen to be 3.0 seconds. Because the focus of the test-bolus acquisition is on time resolution, the targeted spatial resolution was allowed to be relatively coarse, here 3 × 3 × 3 mm3 per voxel. These FOV and spatial resolution values can be converted into the number of samples (NX, NY, NZ) along each direction. As shown in the table, these values can be further converted into the acquisition time necessary, assuming no acceleration. This assumes that the k-space corners are not sampled so as to provide isotropic resolution across the transverse plane (38). Finally, the ratio of image time for the unaccelerated case, 30.9 seconds, with the target 3.0-second temporal footprint gives an indication of the target Rnet, 10.3 in this example.
Table E1. Targeted Performance for CAPR Abdominal CE MR Angiography
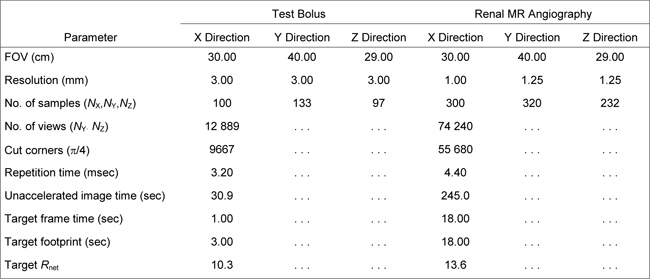
For the second part of the protocol, high-spatial-resolution renal MR angiography, the targeted performance is different but the analysis in Table E1 is identical. Specifically, 1.25 mm or better spatial resolution is targeted within an 18-second breath-hold acquisition. Allowing for an increase in the repetition time from 3.20 to 4.40 msec to accommodate the increased sampling along the frequency-encoding direction versus the test-bolus image, the resultant targeted Rnet is somewhat higher than 10 (13.6). The acquisition technique and receiver coil array were then devised to attempt to allow these targeted acceleration values.
Reference
38. Bernstein MA, Fain SB, Riederer SJ. Effect of windowing and zero-filled reconstruction of MRI data on spatial resolution and acquisition strategy. J Magn Reson Imaging 2001;14(3):270-280.
Supplemental Figures
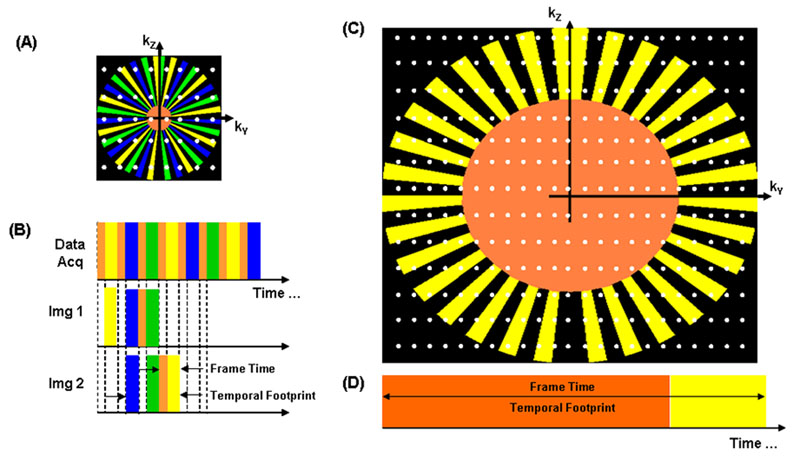
Figure E1: A, B, CAPR ky-kz plane sampling pattern and temporal play-out of views used for reconstruction for the time-resolved test-bolus acquisition and, C,D, the single-phase high-spatial-resolution MR angiograms. The relative size of the k-space diagrams (A vs C) and, accordingly, the length of the frame times (B vs D) demonstrate the more extensive sampling and higher spatial resolution obtained with single-phase MR angiography.
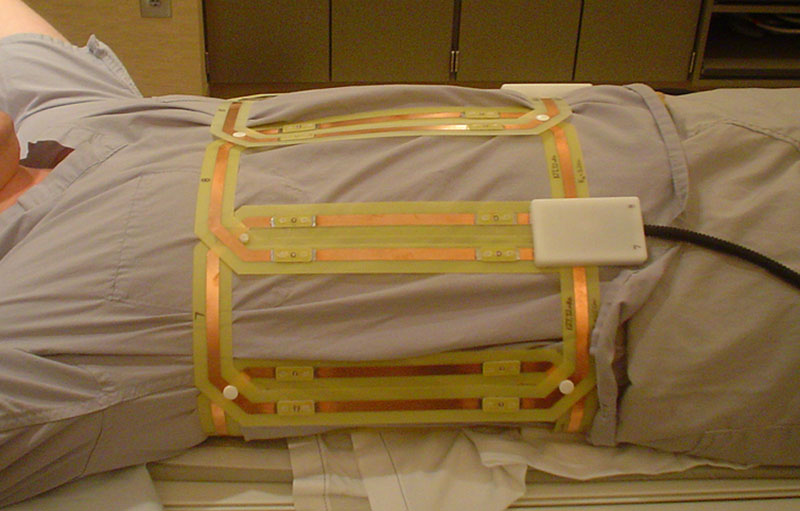
Figure E2: Image of 10-element (14.2 × 27.2 cm2) abdominal array wrapped circumferentially about a subject. The elements are built in modules of two, and the appropriate number of modules is snapped together for the coil to fit completely around the subject's abdomen. The coil was centered on the renal arteries. For imaging studies, a padded cover is wrapped about the coil.

a.
b.
c.

d.
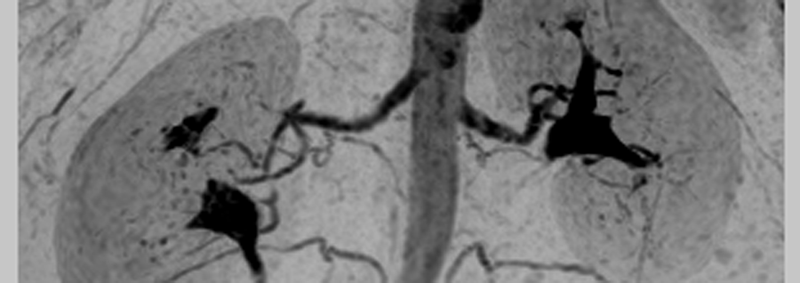
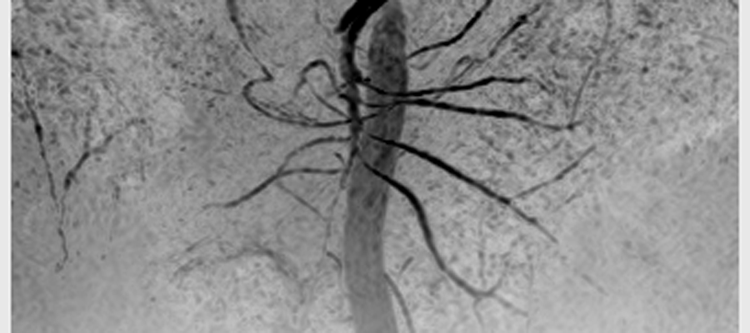
Figure E3: Targeted MIPs from abdominal MR angiography and MR venography (4.33/1.91) in a 53-year-old woman (volunteer 6), in addition to Figure 2. (a-c) Targeted MIPs from the angiogram about the celiac axis, renal arteries, and superior mesenteric arterial branches, respectively, showing sharp depiction of each. (d) Targeted anterior coronal MIP highlighting the fine detail and high SNR obtained even in the venous phase acquisition.
a | b. | c. |
Figure E4: Results from timing image (2.83/1.07) in a 36-year-old woman (volunteer 8). (a-c) Consecutive 0.80-second coronal MIPs with approximately 3.4 mm3 isotropic spatial resolution. Progressive enhancement of the aorta and main renal and mesenteric arteries is captured with high SNR in this rapid 3D acquisition. Despite the relatively coarse spatial resolution, the main renal and mesenteric arteries are well visualized. Details are also in Movie 3.
Movie 1: Rotational MIP of full volume of the timing image (3.24/1.30) in a 53-year-old woman (volunteer 6) (Fig 1). The update time of the movie is equivalent to the acquired frame time of 1.77 seconds.
Movie 2: Rotational targeted MIP of the timing image (3.09/1.23) in a 27-year-old woman (volunteer 7) (Fig 3). The update time of the movie is equivalent to the acquired frame time of 1.17 seconds. Note the presence of an accessory left renal artery with an anomalous origin.
Movie 3: Rotational targeted MIP of the timing image (2.83/1.07) in a 36-year-old woman (volunteer 8) (Fig E4). The update time of the movie is equivalent to the acquired frame time of 0.80 second. There are voxel-to-voxel signal nonuniformities in the test-bolus images that become more apparent the larger the voxel size. These appear to be due to subtle inconsistency problems in the data. Specifically, misregistration or motion between the calibration acquisition and the CAPR acquisition causes some errors in placement of signal intensity during the SENSE reconstruction.
Movie 4: Rotational targeted MIP of the renal angiogram (4.94/2.29) in a 36-year-old woman (volunteer 8) (Fig 4).
Movie 5: Rotation MIP of the timing image (2.75/1.03) in a 37-year-old woman (patient 6). The update time of the movie is equivalent to the acquired frame time of 0.81 second. The time series shows progressive enhancement of the abdominal arteries, as well as the parenchyma of the kidneys and spleen.

