Files in this Data Supplement:
Fig. S1. Short EdU labeling corroborates PCNA-GFP S-phase estimates. (A-C) Typical retina labeled with short pulse EdU (B) counterstained with DAPI (A). (D) The number of retina and nuclei counted. (E,F) The mean number of nuclei counted and the proportion of EdU-positive nuclei to total number. Error bars indicate s.e.m. Scale bar: 50 µm.
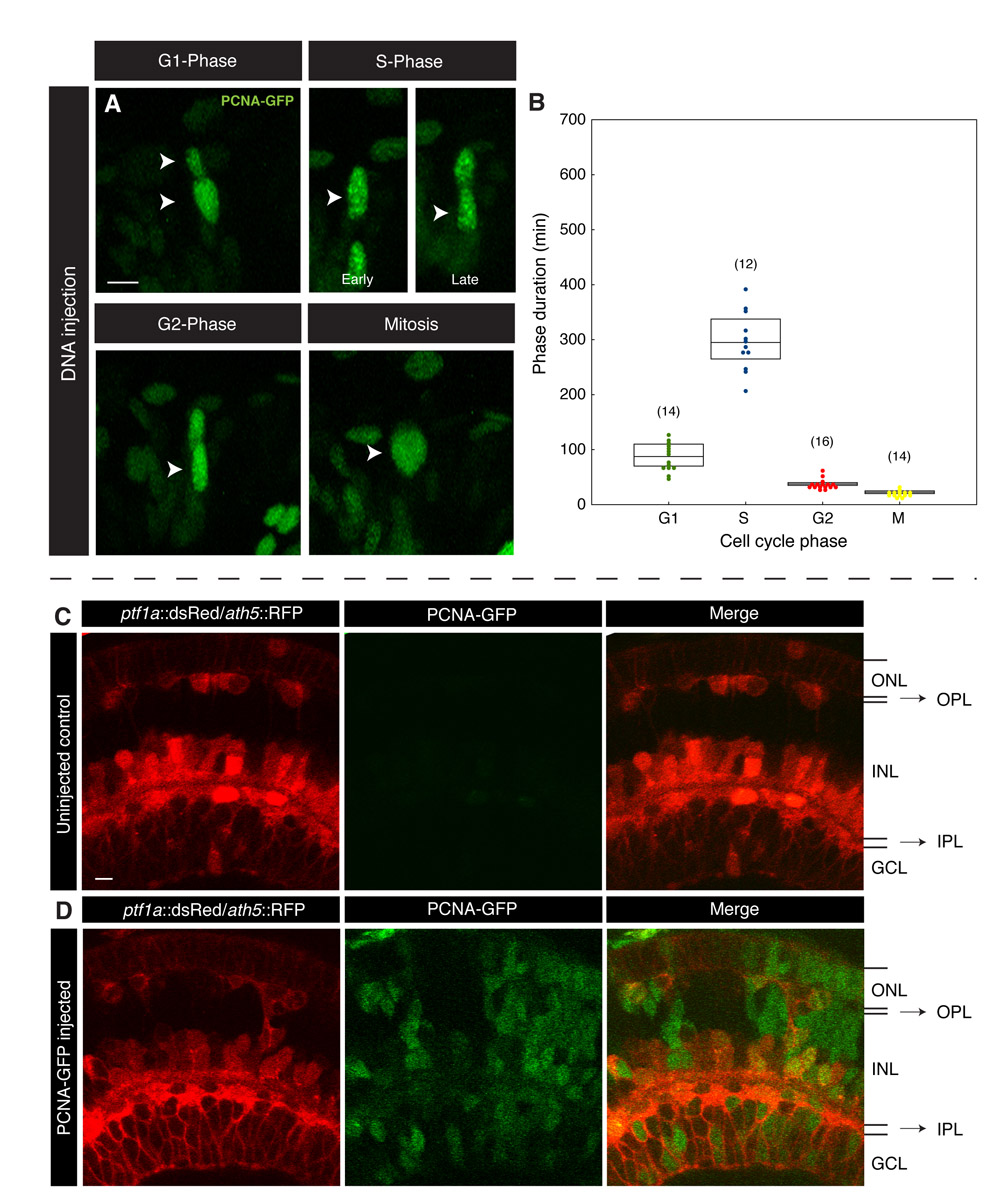
Fig. S2. DNA injection of PCNA-GFP does not affect cell cycle length or phase proportions. (A) DNA injection of PCNA-GFP construct labels retinal nuclei mosaically and, as with RNA injection, all phases of the cell cycle are readily identifiable (arrowheads). (B) Cell cycle phase lengths are broadly similar to those seen with RNA injection. Error bars indicate s.d. and the number of nuclei measured are indicated in brackets. (C,D) Confocal slices through 56 hpf retinas transgenically expressing red fluorophores under the control of ptf1a (dsRed) and ath5 (RFP) promoters. The retinal lamination of an uninjected embryo (C) is compared with a PCNA-GFP-injected embryo (D) and no difference is seen. ONL, outer nuclear layer; OPL, outer plexiform layer; INL, inner nuclear layer; IPL, inner plexiform layer; GCL, ganglion cell layer. Scale bars: 10 µm.
Fig. S3. S phase is distributed throughout the apicobasal extent of retinal and hindbrain epithelia. (A-D) Typical optical slice through retina (A) or hindbrain (B) neuroepithelia at 24 hpf expressing PCNA-GFP through RNA injection. S-phase nuclei dominate in proportion in these tissues and can be seen throughout the apicobasal extent of these epithelia, as further depicted in schematics (C,D), in which S-phase nuclei of the corresponding image are marked (asterisks). (E) Kymographs showing directed apical motion of nuclei (white arrowhead) from S phase to M phase occurring irrespective of their apicobasal start position (red arrow). (F) S- and G-phase length comparison. Each circle represents the G1 (x-axis) and S (y-axis) phase length of a nucleus imaged in time-lapse. There was variability in the duration of both S and G1 between cells, but no correlation between the lengths of G1 and S. Scale bars: 10 µm.
Fig. S4. Typical trajectory plots for nuclei blocked in S and G2 phase. (A) Typical trajectory plot showing a nucleus arrested in S phase with a HU/Aphidicolin cocktail and undergoing no directed movements. (B) A typical trajectory of a nucleus arrested in G2 phase by the Cdk1 inhibitor RO-3306 undergoing no fast apical movements.
Movie 1. PCNA-GFP expressed mosaically in proliferating retinal neuroepithelium. Time-lapse movie of retinal nuclei expressing PCNA-GFP. Cell cycles can be followed over time and cell cycle phases are readily identifiable by PCNA distribution. Images were taken every 5 minutes at 60× magnification and are played at 5 frames per second (fps). Scale bar: 10 µm.
Movie 2. PCNA-GFP in proliferating hindbrain neuroepithelium. Entire cell cycles of hindbrain nuclei can be followed, with individual cell cycle phases readily identifiable (pauses in movie with white arrow labels). Note that apical sides of opposing epithelia are at the midline. Images were taken every 5 minutes at 40× magnification and are played at 5 fps. Scale bar: 10 µm.
Movie 3. Blocking S-to-G2 transition inhibits apical nuclei movements. Time-lapse movie of retinal nuclei expressing PCNA-GFP in the presence of HU and Aphidicolin. Since only small PCNA accumulations form in the presence of the drug, the movie is shown in both grayscale and false color spectrum to aid visualization. Nuclei enter S phase and become blocked in this phase as depicted by the maintenance of PCNA accumulations. No directed nuclear motion was seen. Images were taken every 5 minutes at 60× magnification and are played at 5 fps. Scale bar: 10 µm.
Movie 4. Blocking G2-to-M transition inhibits apical nuclei movements. Time-lapse movie of retinal nuclei expressing PCNA-GFP in the presence of 1 mM RO-3306. Nuclei enter G2 and become blocked in this phase as depicted by loss of PCNA accumulation from the preceding S phase. No directed nuclear motion is seen. Images were taken every 5 minutes at 60× magnification and are played at 5 fps. Scale bar: 10 µm.
Movie 5. Symmetric MRLC distribution during G1 and S phases. Time-lapse movie of retinal nucleus in G1 phase, entering S phase co-expressing PCNA and MRLC (red in middle panel or in false color heatmap, bottom panel). The distribution of MRLC remains symmetrical across the apicobasal extent of the cell around the nucleus in these phases of the cell cycle. Images were taken every 2 minutes and are played at 5 fps. Frames from this movie can be seen in Fig. 4A. Scale bar: 10 µm.
Movie 6. MRLC accumulates basally to nuclei prior to mitosis. Time-lapse movie of retinal nucleus in G1 phase, entering S phase co-expressing PCNA and MRLC (red in middle panel or false color heatmap, bottom panel). Asymmetric accumulation of this signal basal to the nucleus after entry into G2 was observed and occurs prior to the fast apical movement to the apical side, where mitosis takes place. Images were taken every 2 minutes and are played at 5 fps. Frames from this movie can be seen in Fig. 4B. Scale bar: 10 µm.