Acute Ischemic Stroke: Infarct Core Estimation on CT Angiography Source Images Depends on CT Angiography Protocol
© RSNA, 2011
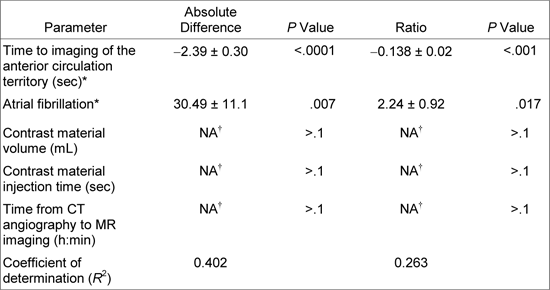
Table E1. Results of Multivariate Linear Regression Analysis of Absolute Difference between Area of Hypoattenuation on CT Angiography Source Images and Volume of Hyperintense Area at DW Imaging and Their Ratio

* Data are coefficients ± standard deviations for multivariate linear regression analysis.
† Only variables with P < .1 were included in the stepwise regression analysis. NA = not applicable.
Supplemental Figure

Figure E1: Bland-Altman plots for interrater agreement for DW imaging (DWI) findings according to study group. There was good agreement, without a significant difference between the two groups, for A, group 1 (mean difference, 1.8 mL; limits of agreement: 6.8, 10.4 mL) and B, group 2 (mean difference, 1.2 mL; limits of agreement: 4.8, 7.1 mL). Dotted line = line of equality.