Files in this Data Supplement:
Fig. S1. Localization of (3)Akt(PHR25C)-GFP in late erythroblasts during enucleation. 2D image of (3)Akt(PHR25C)-GFP in a non-polarized cell is shown. Scale bar: 5 µm.
Fig. S2. The population of late erythroblasts at different stages of enucleation at different time points in culture. The percentages of late erythroblasts at the different stages of enucleation that are classified in Figure 1C at 32 and 36 hours in culture are shown.
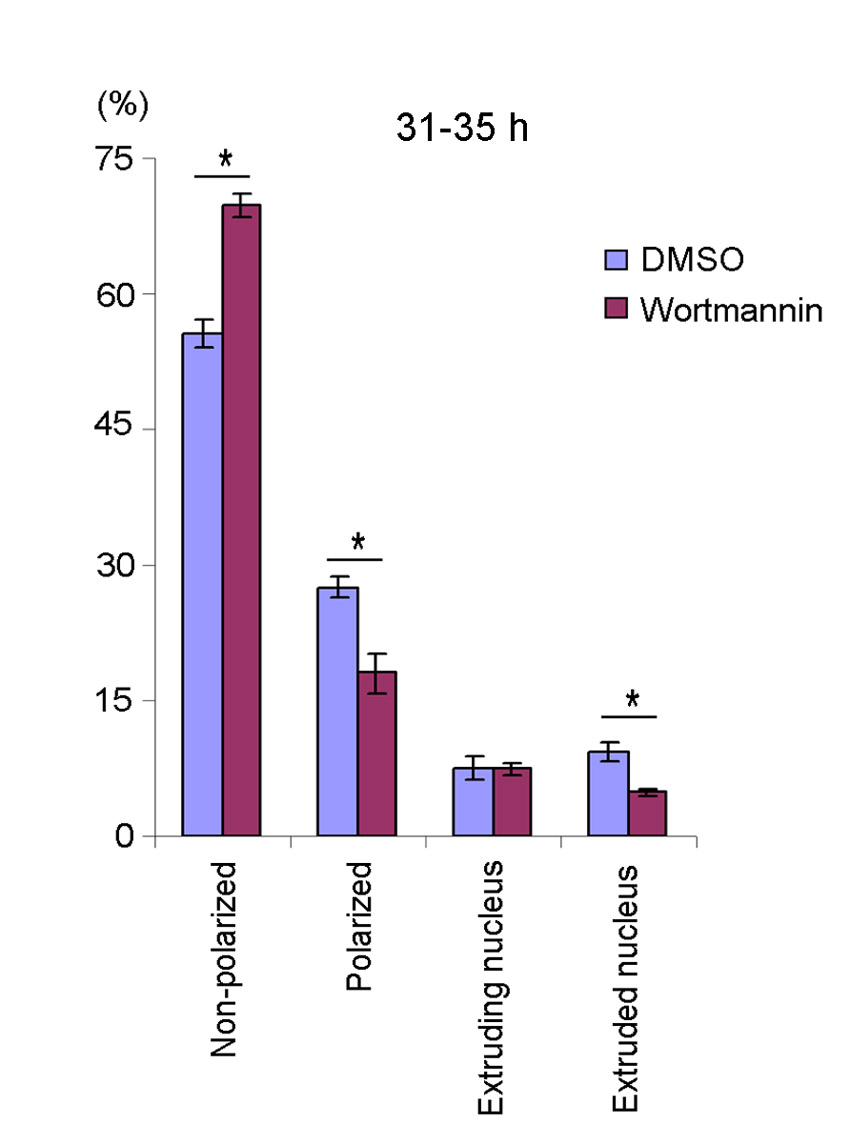
Fig. S3. Quantitative analysis of the progression of enucleation in cells treated with wortmannin. Cells treated with DMSO or wortmannin from 31 to 35 hours in culture were fixed and stained for F-actin and DNA. More than 100 cells were counted in each experiment. Three independent experiments for each treatment were performed. Bars show mean ± s.e.m. *P<0.05.
Fig. S4. Duration and/or delay of enucleation in cells treated with DMSO, LY294002 or nocodazole. Cells treated with DMSO (n=46), LY294002 (n=46) or nocodazole (n=35) were analyzed for the duration and/or delay of enucleation. Blue closed circles show the duration of enucleation (with or without a delay), while red diamonds represent a delay in enucleation in cells that did not complete enucleation during time-lapse imaging and that went out of field of view before enucleation was completed.
Fig. S5. Localization of endogenous γ-tubulin and pericentrin and roles of microtubules in enucleation. (A,B) Cells were fixed and stained for DNA (blue) and γ-tubulin (A) or pericentrin (B). Single wide-field images are shown. Scale bars: 5 µm. (C) Quantification of data obtained with cells similar to those shown in Fig. 5F. The distance between the nuclear and cellular centroids in individual cells treated with DMSO (blue) or nocodazole (red) over time was plotted. Data for three representative cells for each treatment are shown. (D) Z-projections of F-actin in late erythroblasts at 32 hours in culture treated with DMSO or nocodazole. (E) Quantification of data obtained with cells similar to those shown in Fig. 5G. The distance between the nuclear and cellular centroids in individual cells treated with DMSO (blue) or nocodazole (red) over time after the onset of enucleation (time 0) was plotted. Representative cells for each treatment (3 for DMSO and 4 for nocodazole) were shown. (F,G) Quantitative analysis of the progression of enucleation in cells treated with nocodazole. Cells treated with DMSO or LY294002 from 32 to 36 hours (F) or from 36 to 40 hours (G) in culture were fixed and more than 100 cells were counted in each experiment. We considered an extruded nucleus as an enucleated cell. At least three independent experiments for each treatment were performed. Bars show mean ± s.e.m. *P<0.05.
Fig. S6. Localization of endogenous γ-tubulin in cells treated with DMSO or LY294002. Cells treated with DMSO (A) or LY294002 (B) from 31 to 35 hours in culture were fixed and stained for DNA (blue) and γ-tubulin (red). Scale bar: 5 µm.