R-Ras is required for murine dendritic cell maturation and CD4+ T-cell priming
Supplemental materials for: Singh et al
Files in this Data Supplement:
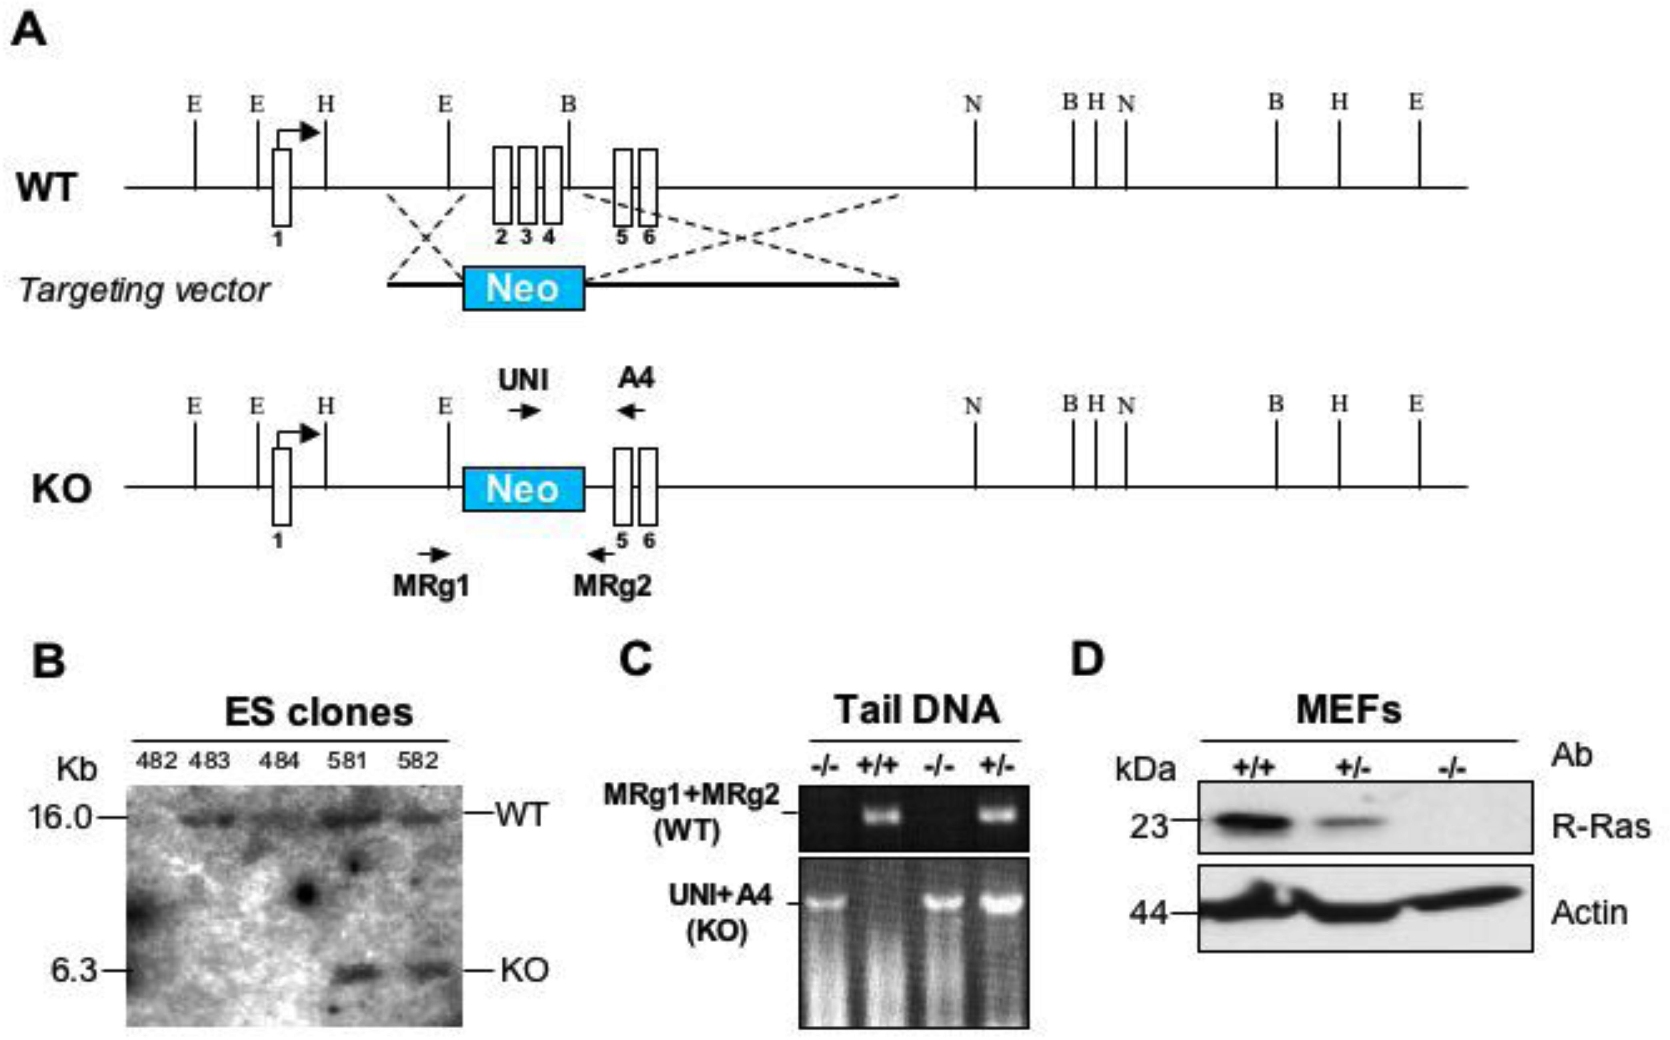
- Figure S1. Generation of a R-Ras knockout mouse strain (JPG, 300 KB) -
(A) Schematic representation of the mouse R-Ras gene (WT) showing the six-exon structure. The targeting vector is depicted (Neo). Exon 2 to 4 were deleted by homologous recombination (KO) showing the primers used for genotype analysis. (B) Southern blot analysis of genomic DNA derived from ES cell clones using an R-Ras-specific sequence as probe. Clones 581 and 582 were positive for the 6.3-kb KO alleles. (C) A typical genotyping of tail DNA from a litter of pups showing the presence of the three genotypes. (D) Western blotting analysis of mouse embryo fibroblasts (MEF) derived from wild-type (+∕+), heterozygous (+∕−), and knockout (−∕−) embryos. Actin was used as a loading control.
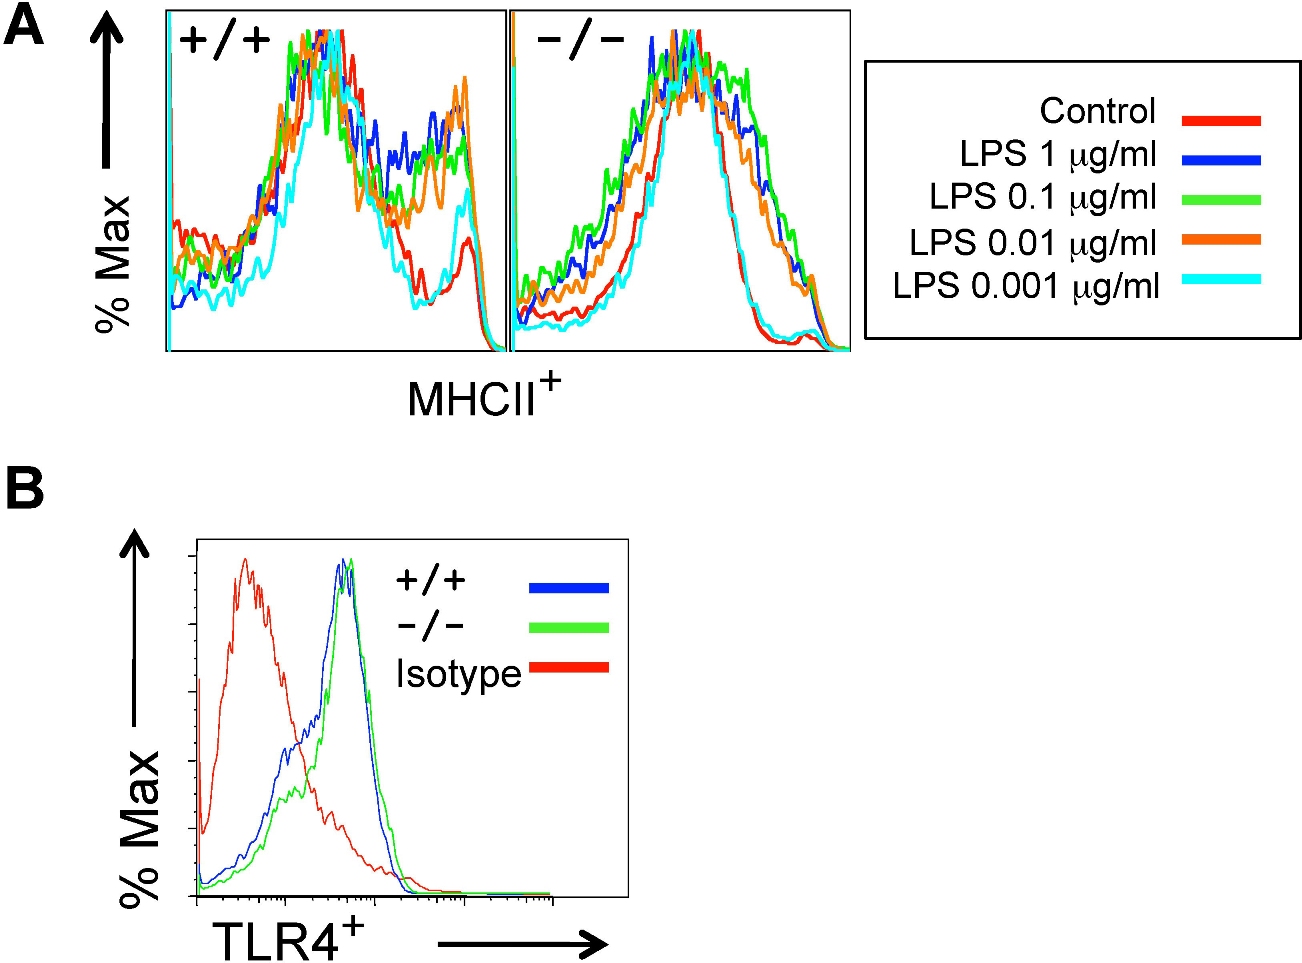
- Figure S2. Aberrant DC maturation in Rras−∕− BM-DC (JPG, 280 KB) -
(A) Bone marrow-derived DCs from Rras+∕+ and Rras−∕− mice were exposed to escalating concentrations of LPS for 12 hrs and surface MHCII was analyzed by flow cytometry. (B) Surface expression of TLR4 of BM-DCs of Rras+∕+ and Rras−∕− mice were measured by flow cytometry showing comparable expression.
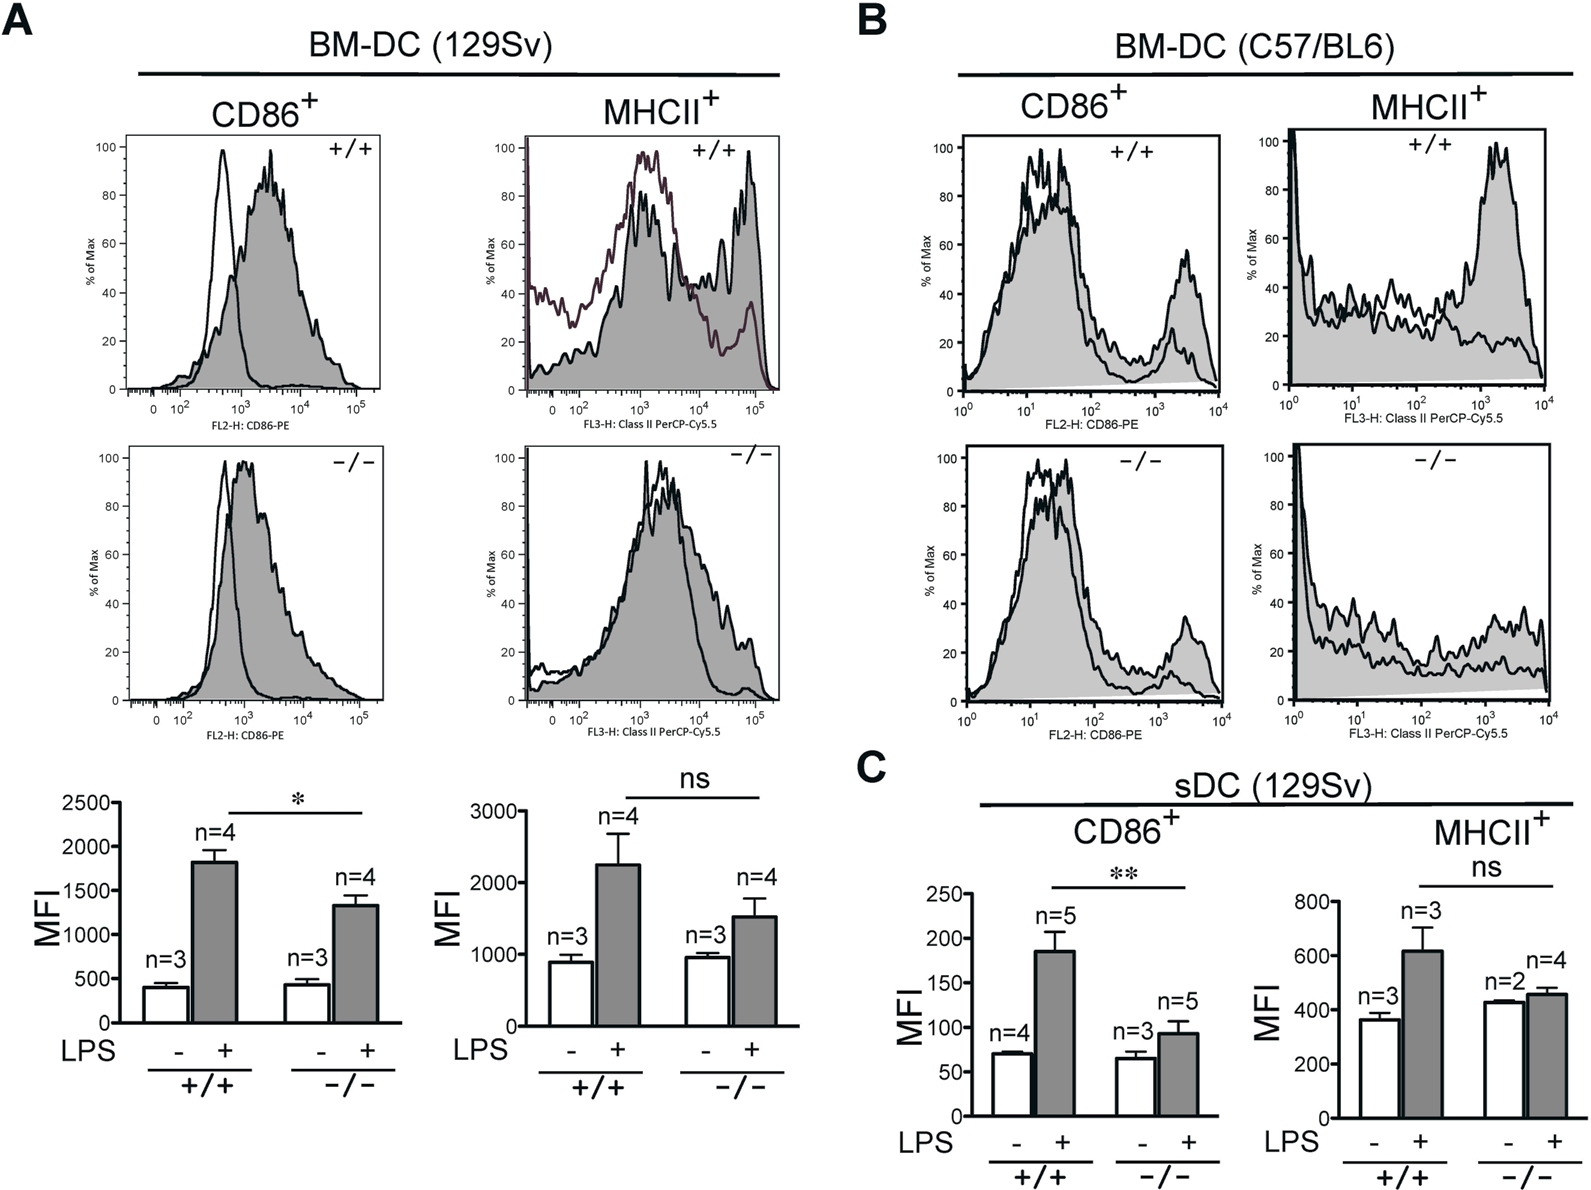
- Figure S3. Impaired maturation of Rras−∕− DCs (JPG, 487 KB) -
(A) BM-DCs from Rras+∕+ (n=3/4) and Rras−∕− (n=3/4) mice in 129Sv background were treated without (opened areas) or with (shaded areas) LPS (0.1 µg/ml) for 12 hrs and surface CD86 and MHCII levels were analyzed by cytometry. MFI values are quantified in the bottom panels. Bars, SE; ns, not significant; * p<0.05. (B) Similar analysis was performed using BM-DCs from Rras+∕+ (n=1) and Rras−∕− (n=1) mice in C57BL/6 background. Maturation markers were plotted as histograms on CD11c+ gated cells. (C) Rras+∕+ (n=2–5) and Rras−∕− (n=2–5) mice were i.p injected with 10 µg LPS (0.45 mg/kg). After 6–8 hrs, the levels of maturation markers were analyzed on CD11c+ gated cells. Bars, SE; **, p<0.005; ns, not significant.
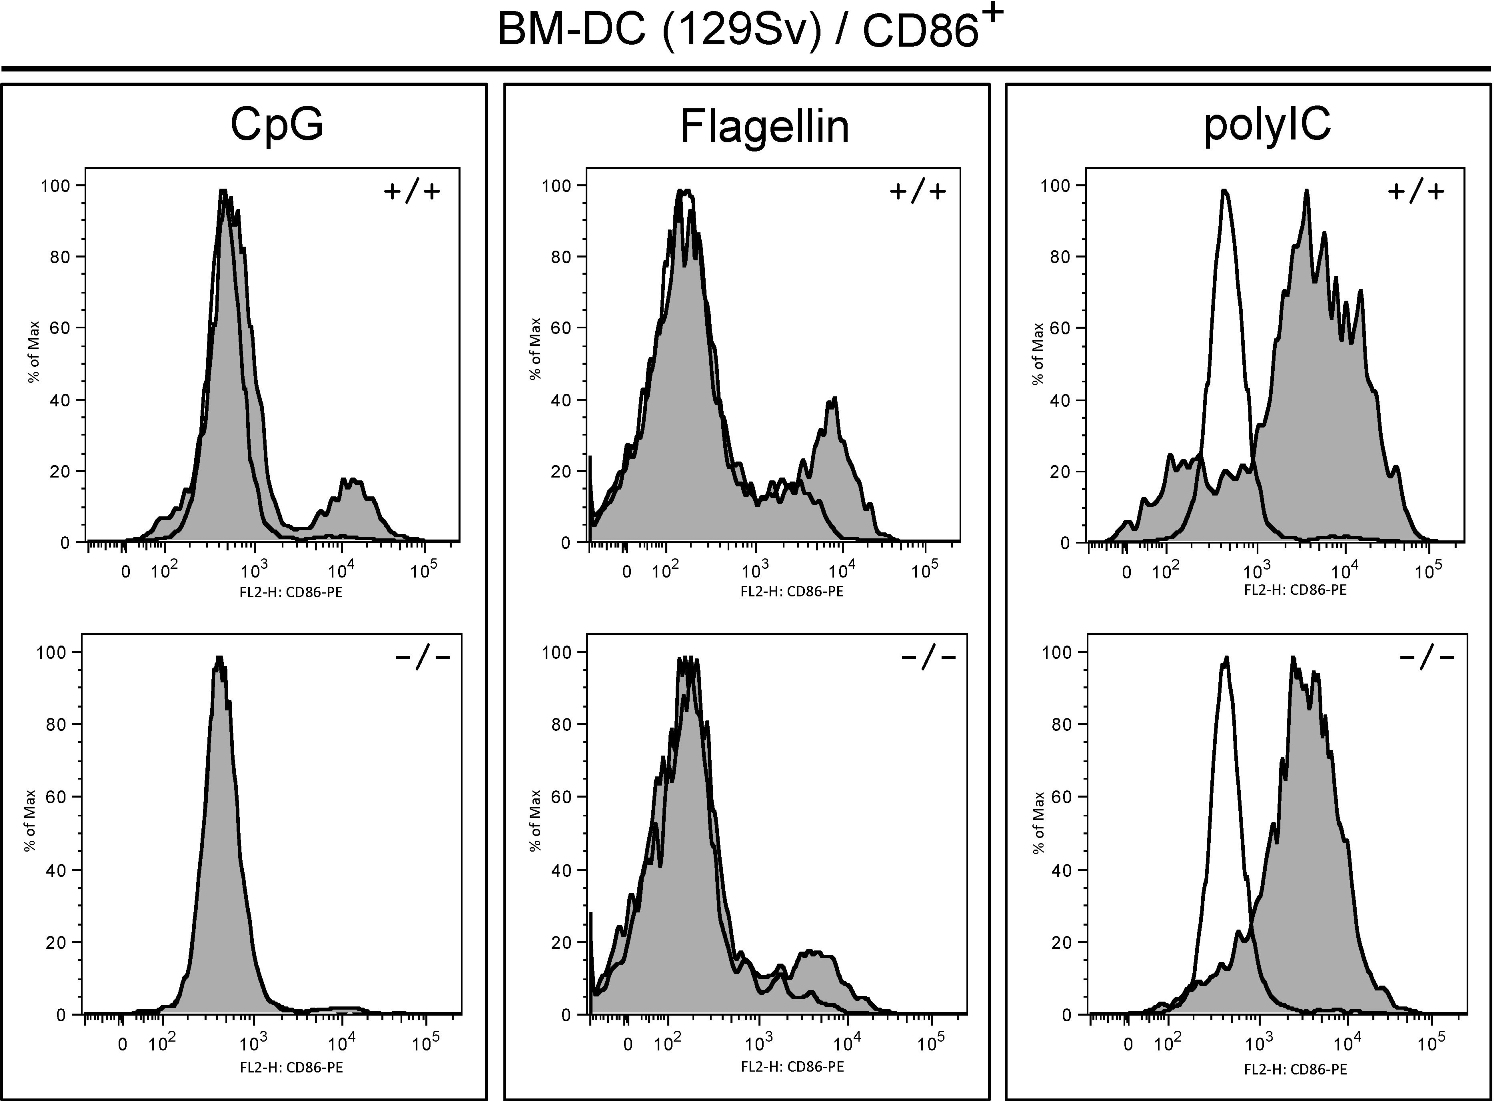
- Figure S4. Impaired CD86 activation by TLRs in Rras−∕− DCs (JPG, 371 KB) -
BM-DCs from 129Sv mice were treated without (opened areas) or with (shaded areas) different TLR ligands, CpG (0.5 µM), polyIC (50 µg/ml), and flagellin (50 ng/ml). Surface expression of MHCII and CD86 was monitored by flow cytometry.
- Video 1. Live-cell videomicroscopy of immature DCs from Rras+∕+ mice commixed with T cells (MOV, 1.44 MB) -
Flat cells with larger cell sizes are DCs while small rounded cells are T cells. Note the dendritic processes extending from matured DCs forming extensive contacts with T cells. - Video 2. Live-cell videomicroscopy of immature DCs from Rras−∕− (V2) mice commixed with T cells (MOV, 3.23 MB) -
Flat cells with larger cell sizes are DCs while small rounded cells are T cells. Note the dendritic processes extending from matured DCs forming extensive contacts with T cells. - Video 3. Live-cell videomicroscopy of LPS (0.1 µg/ml)-stimulated DCs for 12 hrs from Rras+∕+ mice commixed with T cells (MOV, 3.04 MB) -
Flat cells with larger cell sizes are DCs while small rounded cells are T cells. Note the dendritic processes extending from matured DCs forming extensive contacts with T cells. Still images are presented in Fig. 7A. Primary images were captured at 15 secs per frame for 45 minutes. Videos shown were compressed into 9 secs and played at a rate of 20 frames per sec. - Video 4. Live-cell videomicroscopy of LPS (0.1 µg/ml)-stimulated DCs for 12 hrs from Rras−∕− (V4) mice commixed with T cells (MOV, 2.95 MB) -
Flat cells with larger cell sizes are DCs while small rounded cells are T cells. Note the dendritic processes extending from matured DCs forming extensive contacts with T cells. Still are presented in Fig. 7A. Primary images were captured at 15 secs per frame for 45 minutes. Videos shown were compressed into 9 secs and played at a rate of 20 frames per sec.