Supplementary material for Cahana et al. (May 8, 2001) Proc. Natl. Acad. Sci. USA, 10.1073/pnas.101122598
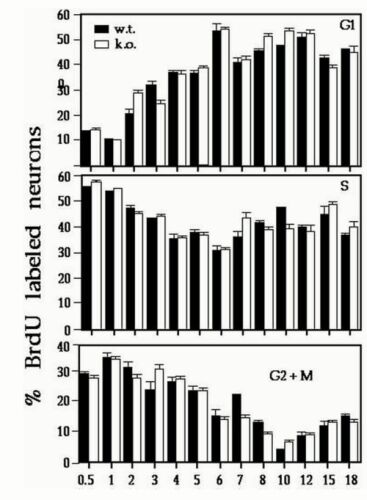
Fig. 8.
Cell-cycle analysis at embryonic day (E)13.5. Monitoring of cell-cycle progression by FACS analysis. The percentages of BrdUrd-labeled cortical cells (y axis) were plotted against the time (hr) after BrdUrd injection (x axis). The FACS analysis allowed separation of the cortical cells into three groups, according to their DNA content (experimental details are provided in Materials and Methods). Cells in G1 phase are characterized by 2 N DNA content, and G2 + M are the 4 N DNA-containing cells, whereas the S phase cells have intermediate DNA content. The black boxes represent the wild-type cells and the white boxes the heterozygote littermate cells. Each box represents the average of four or more littermate embryos ± SE. No significant differences were found between Lis1+/+ and Lis1/sLis1 E13.5 embryos in cell-cycle progression.