Files in this Data Supplement:
Table S1. Comparison of medaka C-myc sequences. (A) Conserved amino acids of full human, fugu and zebrafish C-myc sequences in comparison with medaka C-myc17 and 20. (B) Conservation of C-myc17 and 20 motifs compared between themselves and with human sequences. HLH indicates helix-loop-helix domain; DBD indicates DNA binding domain; LZ indicates Leucine-zipper domain.
Table S2. Analysis of c-myc gene synteny between human and medaka genomes. First column shows genes present upstream human c-myc locus, while the second column indicates the position of the corresponding gene orthologue on the medaka chromosomes. Third column shows genes present downstream of the human c-myc and fourth column the chromosome in which they are found in medaka.
Table S3. Analysis of medaka c-myc17 and c-myc20 gene synteny. First column shows genes present upstream and downstream c-myc17, second column shows genes present upstream and downstream c-myc20, third column shows genes present upstream and downstream fugu c-myc gene and fourth column shows in which chromosome from medaka the orthologue in fugu is present. Genes marked with one asterisk (*) are genes present on medaka chromosome 17 that are duplicate in the medaka genome and where its corresponding copy is present in chromosome 20. Genes marked with two asterisks (**) are genes present in medaka chromosome 20 that are duplicated in the medaka genome and where its corresponding copy is present on chromosome 17. Black lines indicate corresponding gene orthologues between the different genomic regions.
Table S4. Primers used in this work. All qPCR primers are designed to span one or more exons.
Fig. S1. Alignment of C-myc protein sequences. Human, mouse and fugu C-myc protein sequences were aligned with medaka C-myc17 and medaka C-myc20. Black boxes highlight conserved amino acid residues (more than 75% conservation in all sequences). Yellow arrows and yellow highlighted residues indicate known amino acid sites for posttranslational modifications in the human Myc protein, e.g. phosphoserine and N6-acetyllysine modifications, as stated in the uniprot database. Positional numbers besides the yellow arrows indicate modification positions in the human protein.
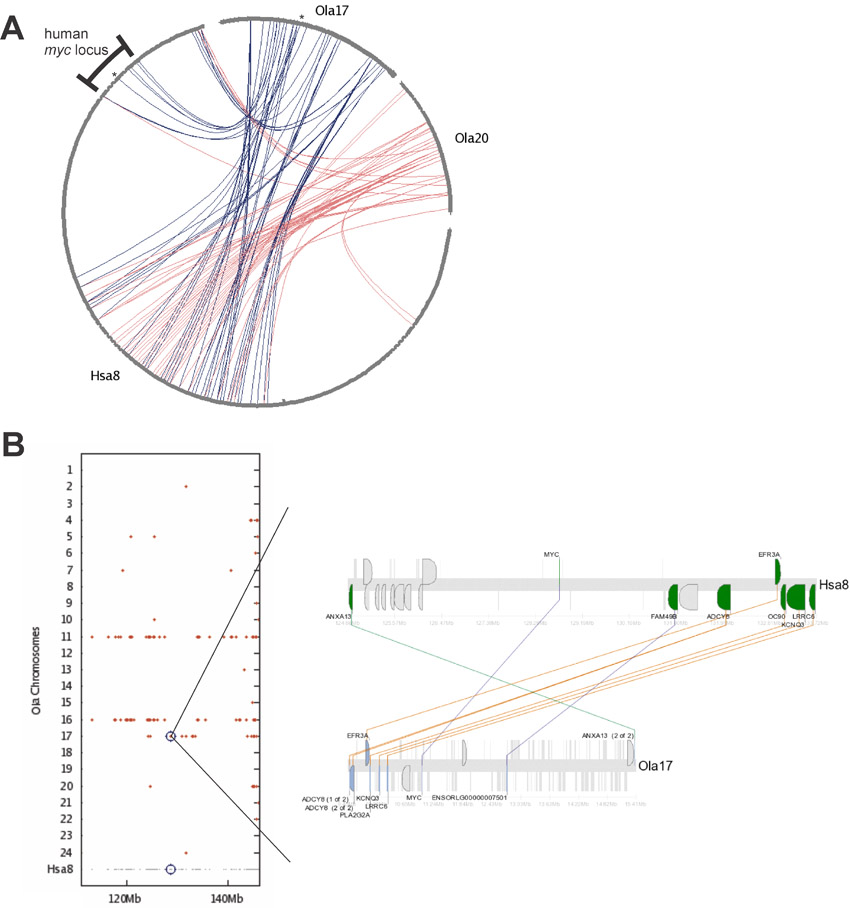
Fig. S2. Synteny analysis of the medaka cmyc in comparison to human. Analysis of c-myc gene synteny was performed utilizing the ENSEMBL database and the Synteny database. (A) Blue lines show conserved loci between human chromosome 8 and medaka chromosome 17. Red lines show conserved loci between human chromosome 8 and medaka chromosome 20. The asterisk (*) indicates c-myc genes on human and medaka chromosomes. The human cmyc locus, 10MB around the human c-myc gene, is indicated. (B) shows on the x-axis the complete human chromosome 8, while the y-axis represents all medaka chromosomes. Red dots indicate synthenic regions between species. Blue rings mark the position of human c-myc at 8q24 and potential regions of c-myc homologues in the Medaka. The magnified picture illustrates the corresponding chromosome regions, containing neighboring genes on the human and the medaka loci. Medaka c-myc20 is not present in the analysis because it is not annotated in the used databases.
Fig. S3. c-myc17 and c-myc20 expression in medaka. (A to H) show expression of both genes during early stages of development visualized by in-situ hybridization. Arrows indicate regions of different expression in midbrain structures. (I) and (J) show qPCR of both endogenous c-myc genes present in Medaka during different developmental stages and in different adult organs, respectively. Expression of either c-myc17 or c-myc20 was normalized against expression at stage 33 (I) or against expression in brain tissue (J).
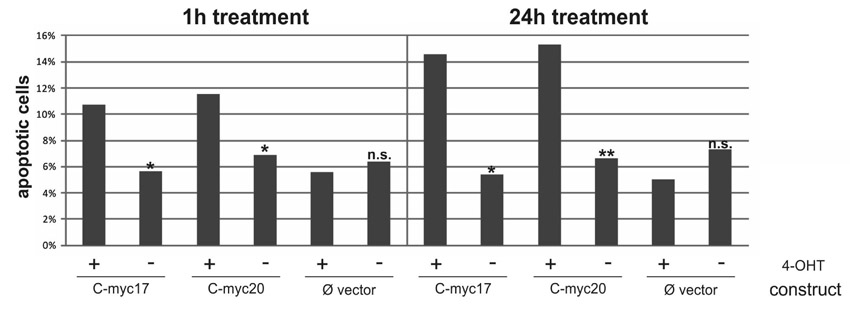
Fig. S4. Comparison of c-myc17 and c-myc20 function in A2 cells. Caspase immunofluorescence in transiently transfected A2 cells revealed that cells transfected either with c-myc17-ER or c-myc20-ER had a higher apoptosis rate after tamoxifen treatment in comparison to the control after 1 hour (left panel) and 24 hours (right panel) of treatment. Asterisk indicate significant differences (*=P<5%, **=P<1%) while n.s. indicates not significant differences between +4-OHT treated and −4-OHT control values in a two sided, heteroscedatic student t-test.
Fig. S5. Comparison of myc17ER transgene expression via qPCR in tissues of individuals from the two transgenic medaka lines. The table shows Ct-values and calculations, while the graph displays the transgene expression levels normalized to liver of individual 1 from line 1.
Fig. S6. c-myc17 and c-myc17ER transgene expression in medaka. (A) shows relative expression levels of endogenous c-myc17 and the transgene c-myc17-ER in different organs of both established lines via qPCR. (B) shows a qPCR comparison of c-myc17 and the transgene c-myc17ER expression in eyes of untreated, ethanol treated control and tamoxifen treated fish.