Files in this Data Supplement:
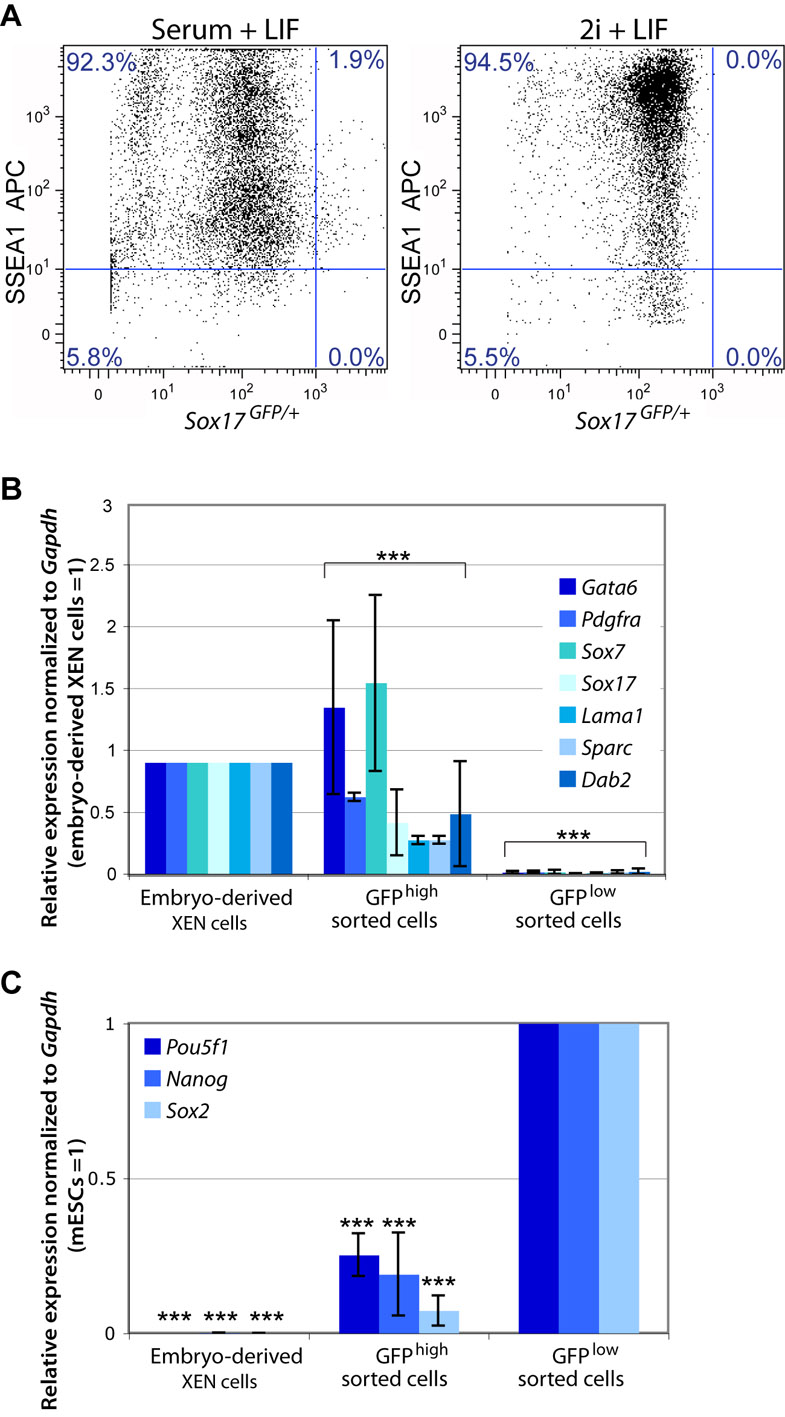
Fig. S1. XEN-like cells are present in mES cells cultured in LIF and serum, but not in the presence of Erk- and Gsk3-inhibitors (2i). (A) Sox17GFP/+ reporter mESCs in conventional serum and LIF conditions were compared by flow cytometry to Sox17GFP/+ reporter cells maintained in 2i and LIF. No antibody control, secondary antibody control and wild-type mESCs established background (data not shown). Dead cells were excluded with 7AAD prior to analysis. (B,C) Quantitative RT-PCR analysis of GFPlow- versus GFPhigh-expressing cells from mESCs (serum and LIF) following flow cytometry. Gene expression was compared with embryo-derived XEN cells for (B) extra-embryonic endoderm-associated genes (Gata6, Pdgfra, Sox7, Sox17, Lama1, Sparc and Dab2) or (C) pluripotency-associated genes (Nanog, Pou5f1 and Sox2). Relative expression after normalization to Gapdh is reflected as a fold difference compared with embryo-derived XEN cells or mESCs, respectively. Data are the mean normalized values of technical replicates ±s.e.m. ***P<0.001
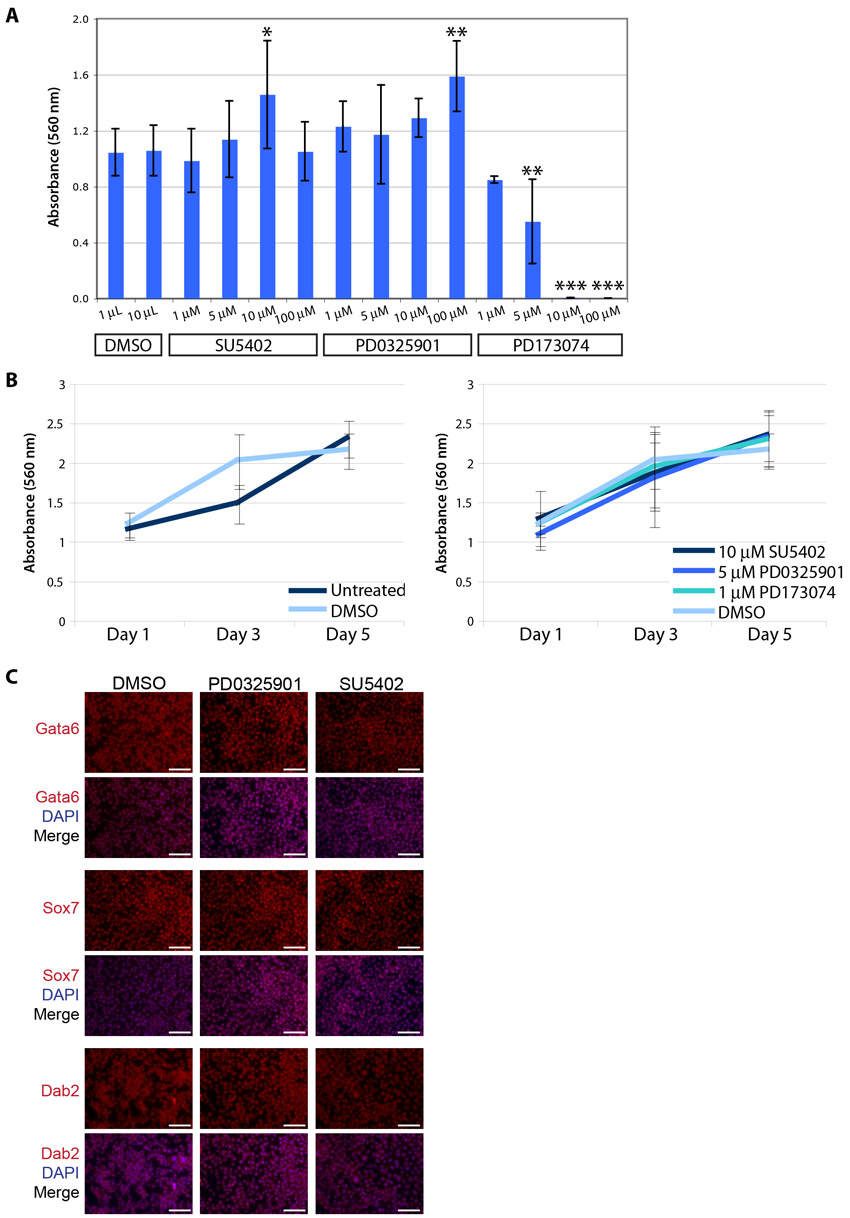
Fig. S2. FGF/ERK signalling is not required for XEN cell maintenance. (A) mESCs were maintained in KSR and LIF in the presence or absence of FGF- or ERK-signalling inhibitors. An MTT assay was performed after 3 days of treatment in the various conditions. Data shown are the mean absorbance values ±s.e.m. of three biological replicates. Statistical significance was determined by comparing inhibitor treatment with DMSO controls. *P<0.05; **P<0.01; ***P<0.001. (B) Embryo-derived XEN cells or cXEN cells were maintained in standard XEN media and treated with 10 µM SU5402, 5 µM PD0325901, 1 µM PD173074 or DMSO, or untreated. An MTT assay was performed 1, 3 and 5 days following treatment. Data shown are the mean absorbance values ±s.e.m. of two biological replicates. (C) Immunofluorescence analysis of stable cXEN cells after 4-day treatment with 5 µM SU5402 or 5 µM PD0325901 in standard XEN media for Gata6, Sox7, Dab2, expression (red) and DAPI (blue) merge (representative of four cXEN cell biological replicates). Scale bars: 100 µm.
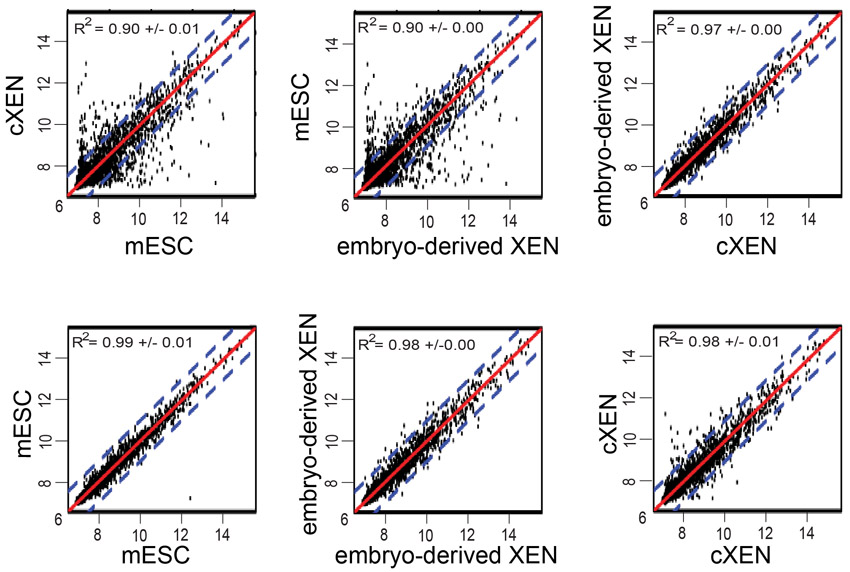
Fig. S3. cXEN and embryo-derived XEN cells correlate more closely with respect to their global gene expression than do mESCs. Representative scatter plots of global gene expression intensity comparison of cXEN cells, mESCs and embryo-derived XEN cells. R2-value represents the correlation coefficient used as a measure of the relationship in global gene expression between cell lines. Red line represents the line of best fit (R2=1) and the blue dash lines represent the correlative range (±1). All plots are on a log scale and values are the average of two (embryo-derived XEN cells) or three (cXEN or mESCs) biological replicates.
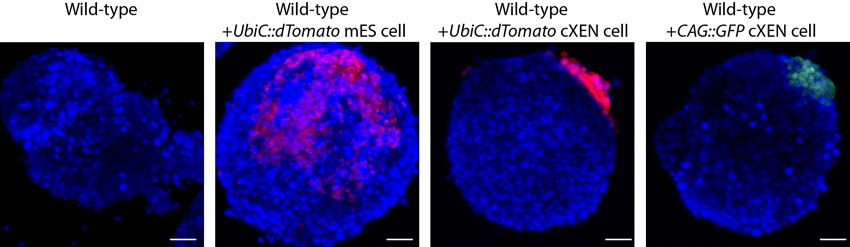
Fig. S4. cXEN cells are extra-embryonic endoderm committed. Two hundred wild-type mESCs were aggregated with a single UbiC::dTomato mESC or cXEN cell or a single CAG::GFP XEN cell. Embryoid bodies were generated using the hanging drop technique. After 5 days, embryoid bodies were collected, stained with Hoechst nuclear dye (blue) and imaged on a confocal microscope. The contribution of the fluorescently labeled cells to the interior and/or periphery of chimera embryoid bodies was quantified (supplementary material Table S10). Representative magnification confocal projections are shown.
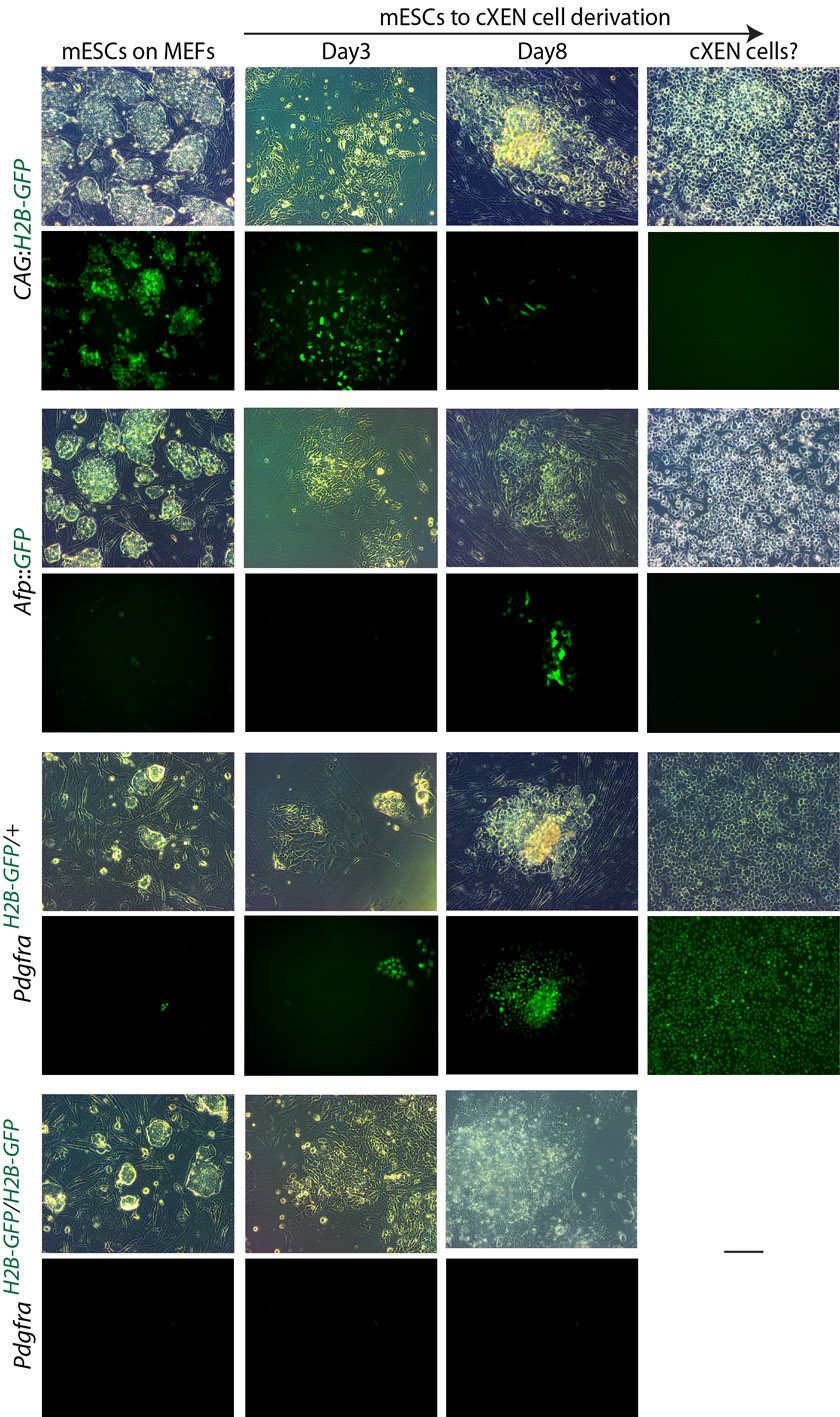
Fig. S5. cXEN cell derivation from transgenic reporter cell lines. mESCs robustly express CAG::H2B-GFP in the nucleus of all cells, whereas cXEN cells have downregulated this expression, suggesting the silencing of the locus or the silencing of the CAG promoter. We repeated the cXEN protocol with CAG::YFP mESCs (data not shown) and saw a similar effect of silencing once the cXEN cell lines were established, suggesting that the CAG promoter is repressed in established cXEN cell lines. Afp::GFP mESCs express few Afp::GFP-high cells in cXEN cell derivation conditions. PdgfraH2B-GFP/+ mESCs were differentiated into cXEN cell lines that express high H2B-GFP. cXEN cell lines could not be established from PdgfraH2B-GFP/H2B-GFP mutant mESCs, which suggests an essential function for Pdgfra in cXEN cell derivation.
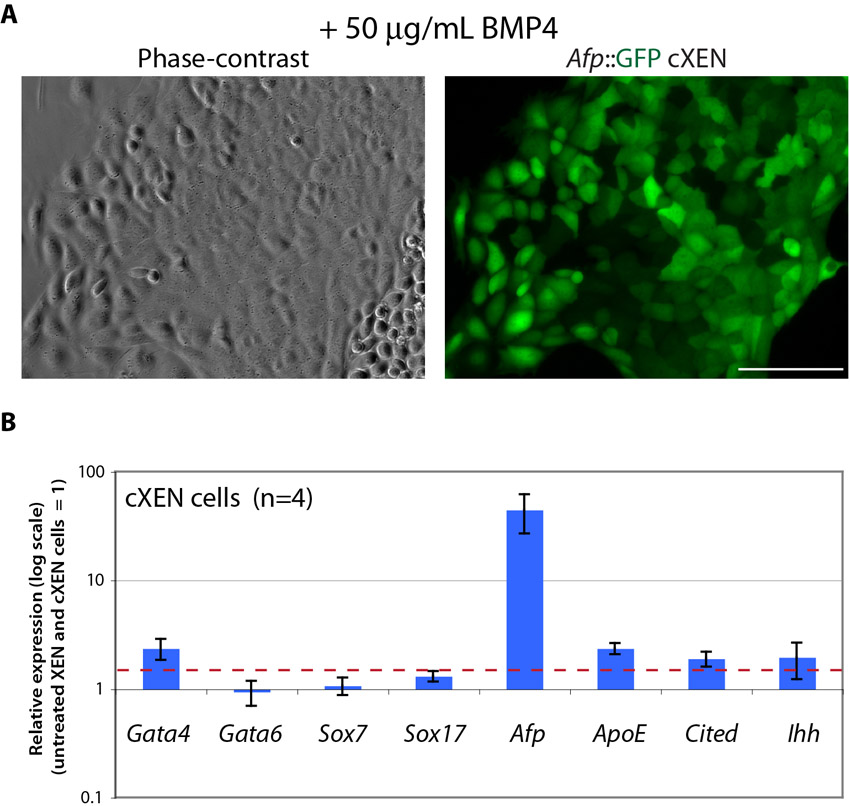
Fig. S6. BMP4 treatment induces VE differentiation of cXEN cells. (A) Afp::GFP cXEN cells were treated with 50 µg/ml BMP4 for 9-12 days. The BMP4 treated cells upregulate Afp::GFP expression and grow as epithelialized colonies. (B) Afp::GFP-high cells following 50 µg/ml BMP4 were enriched by manually picking prior to quantitative RT-PCR analysis. Gene expression was normalized to Gapdh and reflected as a relative expression (log scale) compared with the expression in untreated embryo-derived XEN and cXEN cells (=1). Data shown are the mean of the relative expression ± s.e.m. of four technical replicates. The red dashed line indicates 1.5-fold difference.
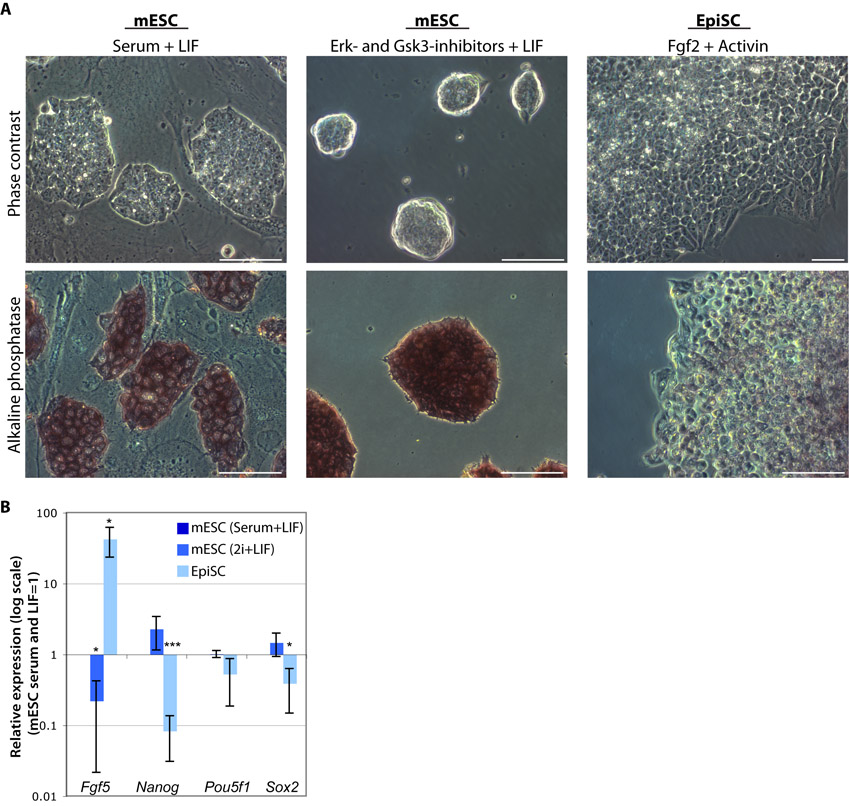
Fig. S7. Molecular characterization of pluripotent stem cell lines. (A) Alkaline phosphatase staining of mESCs maintained in LIF and serum or Erk- and Gsk3-inhibitors (2i) and EpiSCs maintained in FGF2 and Activin. (B) Quantitative RT-PCR analysis of pluripotent stem cells. Gene expression is normalized to Gapdh and reflected as a relative expression (log scale) compared with mESCs maintained in serum and LIF (=1). Data shown are the mean of the relative expression ±s.e.m. of two or three biological replicates. *P<0.05; **P<0.01; ***P<0.001.