A Receptor-targeted Fluorescent Radiopharmaceutical for Multireporter Sentinel Lymph Node Imaging
© RSNA, 2012
Appendix E1
Synthesis and Characterization of Optically Labeled Tilmanocept
Conjugation of the optical reporter, a cyanine dye (1), to tilmanocept proceeded in a manner previously described (2). Tilmanocept was dissolved in 150 mmol/L Na2CO3 (pH 9.3) buffer to produce a 60-nmol/mL solution. One milligram (approximately1 mmol) of cyanine 7 (Cy7) monoreactive N-succinimidyl ester (GE Healthcare, Little Chalfont, England) was dissolved in 40 μL of analytic-grade dimethylsulfoxide (DMSO). A portion of the DMSO solution containing 60 nmol of the dye was combined with 20 nmol of the buffered tilmanocept solution; this reaction was used for the mouse imaging studies. The reactions were incubated for at least 1 hour at room temperature before purification with size-exclusion chromatography (PD10; GE Healthcare), with phosphate-buffered saline (pH 7.4) as the mobile phase. Estimation of Cy7 density was defined as the average number of Cy7 molecules per tilmanocept molecule and was calculated in the following manner: The optical absorbance of Cy7 tilmanocept at 747 nm was measured and compared with a standard curve, which was created by measuring the absorbance of unconjugated Cy7 at various concentrations. The concentration of tilmanocept was determined with the sulfuric acid method (3). Absorbance and emission spectra were measured for unconjugated Cy7 and Cy7-conjugated tilmanocept preparations. Absorbance spectra were obtained at five dilutions of each Cy7 tilmanocept preparation and unconjugated Cy7. All solutions were in 0.9% saline (pH 6.0) within a 10-mm cuvette, with all absorbances below 0.05 units. Emission spectra (710–850 nm, 5-nm slit width) fitted with a photomultiplier tube were excited at 700 nm. Absorbance spectra were acquired between 400 and 850 nm (1.5-nm slit width).
Radiolabeling Cy7 Tilmanocept with Technetium 99m
Radiolabeling of Cy7 tilmanocept (Fig 1a) with technetium 99m (99mTc) used a tin reduction method (4). Cy7 tilmanocept (volume, 0.05-0.07 mL; concentration, 0.75-15 nmol) and sodium pertechnetate (volume, 0.25-1.0 mL; radioactivity, 2.2-5.6 GBq) were combined in a 10-mL multidose vial fitted with a rubber septum. After purging the vial with medical-grade nitrogen for 10 minutes, a fresh acidic solution (0.10 mL) of stannous chloride (5 mg SnCl2 in 0.175 mL 37% HCl followed by 20 mL of saline) was added. After swirling, the vial was placed in a lead shield, where it remained for at least 1 hour at room temperature. At least 0.2 mL of phosphate-buffered saline (pH 7.4) was added to bring the solution to a known volume (0.5-1.5 mL).
a. | b. |
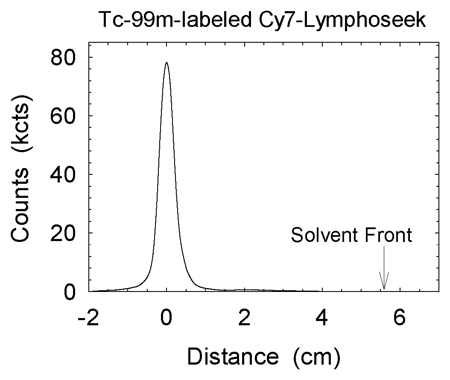
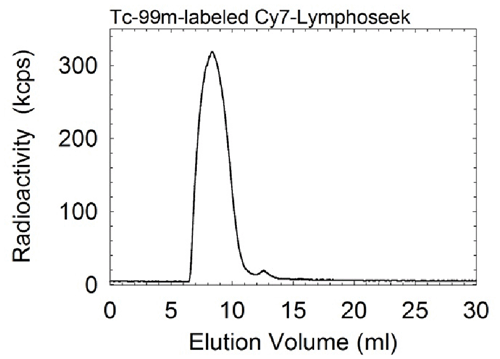
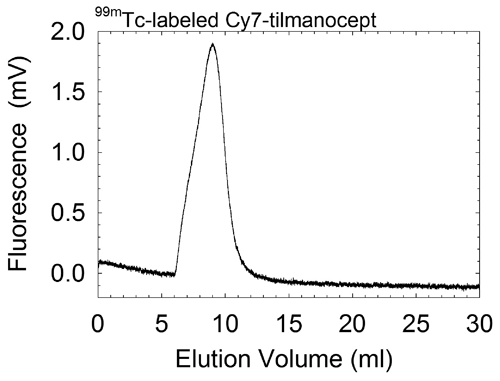
c. | Figure E1. (a) Graph shows radiochemical purity of all 99mTc-labeled Cy7 tilmanocept preparations was in excess of 98%. ITLC revealed one component, which resided at the origin. Pertechnetate migrates with the solvent front. (b) Graph shows radiochemical purity of all 99mTc-labeled Cy7 tilmanocept preparations exceeded 98%. High-performance liquid chromatography revealed single components when monitored with radioactivity detection. (c) Graph shows high-performance liquid chromatography revealed single components when monitored with fluorescence detection. Elution volume of unreacted fluorophore is 12.0 mL. Fluorophore density of this sample was 0.90 Cy7 molecule per tilmanocept molecule; fluorophore conjugation was performed 4 months prior to HPLC. |
Quality control consisted of instant thin-layer chromatography (ITLC) with acetone as the mobile phase and an 8-cm strip of Whatman 31ET as the stationary phase. Unlabeled 99mTc migrated with the solvent front, and 99mTc-labeled Cy7 tilmanocept remained at the origin. Radiochromatograms were obtained by scanning each ITLC strip with a radioactivity detector (AR2000; Bioscan, Washington, DC). We also performed size-exclusion high-performance liquid chromatography. The mobile phase consisted of 0.9% saline (1.0 mL/min) delivered via a solvent delivery system (System Gold 126 Delivery Module; Beckman-Coulter) in the isocratic mode and a TSK G2000SW stationary phase (300 × 7.8 mm and 10 × 7.8 mm) (Tosoh Bioscience, South San Francisco, Calif). We monitored radioactivity (Model 170; Beckman Instruments, Fullerton, Calif) to detect 99mTc, and we monitored fluorescence (excitation l = 758 nm, emission l = 780 nm) (Model L-7480 with a modified PMT; Hitachi High-Technologies, Tokyo, Japan) to detect the presence of Cy7. Fluorescence detection of unconjugated fluorophore (Cy7-NHS-ester treated with 0.9% saline) exhibited multiple peaks, with the dominant peak having an elution volume of 12.0 mL. All labeling reactions resulted in radiochemical yields in excess of 98% and single components within the fluorescence and radioactivity chromatograms (Figs E1, E2).

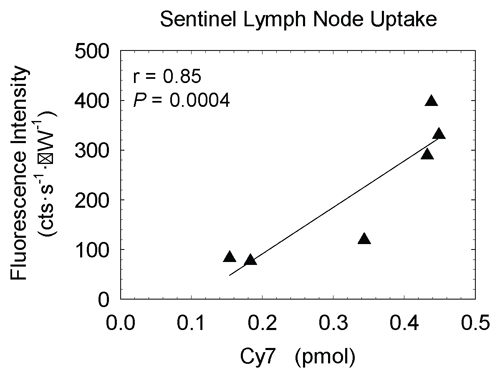
Figure E2: Graph shows mouse fluorescence imaging radioactivity studies of 99mTc-labeled Cy7 tilmanocept demonstrated receptor binding to SLNs. Six mice (low-dose group) were injected with an amount (0.11 nmol) of Cy7 tilmanocept that would not saturate receptors within SLNs. There was significant (r = 0.85, P < .001) correlation between the scaled SLN fluorescence intensity at the end of each study and the amount of SLN Cy7, as measured by 99mTc activity within each excised lymph node.
Measurement of Receptor Affinity
We measured the equilibrium dissociation constant of Cy7 tilmanocept by using an in vitro binding assay with J774E or J774 macrophages (5). The assays were conducted at 4°C to eliminate the effect of receptor recycling. Clone E or wild-type (J774) cells were resuspended in Hank's balanced salt solution plus 1% bovine serum albumin (Sigma Biochemicals, St Louis, Mo) to produce a cell concentration of 4 × 10⁷ cells per milliliter; 99mTc-labeled Cy7 tilmanocept or 99mTc-labeled tilmanocept was added to the cells to produce five different tilmanocept concentrations (0.125, 0.25, 0.75, 1.5, and 30 nmol/L), each within a volume of 0.5 mL containing (1 to 2) × 107 cells. The radiochemical purity of each Cy7 tilmanocept dilution was measured with ITLC prior to combining it with the cells. After 1-hour incubation on ice, four 0.1-mL aliquots of the mixture were added to 0.3-mL narrow-tipped polypropylene microcentrifuge tubes (#72.702; Starstedt, Nümbrecht, Germany) containing 150 mL of oil (4:1 ratio of silicon oil 550 to mineral oil) (6). The tubes were spun for 30 seconds at 12 000 times gravity. Cell pellets were separated from the supernatant by cutting the tube through the oil layer. The pellet and supernatant portions were separately assayed for radioactivity by using a 100–200-keV energy window. We assumed that all of the receptor-bound Cy7 tilmanocept and tilmanocept resided in the pellet and that all of the unbound Cy7 tilmanocept and tilmanocept resided in the supernatant. Binding assays with the wild-type cells yielded Scatchard plots without a specific-binding component; regression analysis of these data with the software program LIGAND failed to converge.
Calculation of Optical Imaging Parameters
Sentinel lymph node (SLN) accumulation rates and scaled peak fluorescence intensities were calculated from each SLN region of interest in the following manner: Integrated fluorescence was normalized by the examination duration and excitation power to yield scaled fluorescent intensity in units of counts per second per microWatt; this metric was plotted against time (0-160 minutes after injection). After linear regression (JMP, version 9.0.0 2010; SAS Institute, Cary NC) of the unweighted SLN intensity values, the slope of the regression line was divided by the intercept. The result was defined as the SLN uptake rate constant. The purpose of normalizing the uptake rate to units of hour–1 was to remove variations due to scatter and attenuation. The intercept was also used to correct the fluorescence intensity values for autofluorescence. An individual data point was excluded from regression analysis if the residual was in excess of 20%, which occurred in two studies. The regressions typically resulted in a root mean squared error of approximately 7% of the response mean. The range of this metric was 1.4%-12%. The highest value within a scaled integrated fluorescence intensity curve was defined as the scaled peak intensity and was reported in units of counts per second per microWatt. Time-intensity curves were formed by multiplying the scaled integrated fluorescence intensity by the excitation power and plotting the y-axis in units of kilocounts per second.
Calculation of SLN Receptor Density
The fact that the radioactive and fluorescent labels are attached to the same molecule enabled us to calculate the absolute amount of tilmanocept within each lymph node. On the basis of the assumption that the high dose resulted in SLN receptor saturation, the measurements from the imaging experiments permitted us to estimate the amount of receptor within each lymph node. The mean SLN uptake in the low-dose group was 0.44 pmol of tilmanocept, and the mean tilmanocept uptake in the high-dose SLNs was 49 pmol. Consequently, we estimated the amount of available SLN receptor to be approximately 50 pmol. Most important is the knowledge that a 0.11-nmol injection of Cy7 tilmanocept, which carried 0.078 nmol of Cy7, occupied less than 1% of the receptor population within the SLN.
Calculation of Imaging Signal for a Human Study
The imaging studies showed that a receptor-targeted fluorescent imaging agent can provide ample signal for a clinical imaging study by using the same amount (3 nmol) of tilmanocept used for nuclear imaging (7). A signal-to-background ratio for a human imaging study can be estimated for the following scenario: a 3-nmol dose of Cy7 tilmanocept with a Cy7 density of 1 Cy7 per tilmanocept, a 0.4% uptake of Cy7 tilmanocept by the SLN, and an SLN with a 4-mm diameter. On the basis of a detector sensitivity of 1.5 × 10³ counts · sec-1 · μW-1 per picomole of Cy7, 12 pmol of Cy7 within the SLN would yield a scaled fluorescence intensity of 18 × 103 counts · sec-1 · μW-1. Estimates of the tissue attenuation of NIR photons range from a factor of 16 (8) to a factor of 100 (9). Consequently, if the SLN was 1 cm below the skin or surgical plane, the scaled intensity would range from 180 to 1125 counts · sec-1 · μW-1. A 4-mm lymph node would comprise nine 1.5 × 1.5-mm pixels, which would produce an autofluorescence background of 5.8 counts · sec-1 · μW-1. These approximations lead to signal-to-background ratios that range from 31:1 to 194:1 for a 1-cm-deep fluorescent SLN. Current fluorescence imagers (10) operate at an illumination power of 1000 mW and have a detection sensitivity that is 10-fold less than that of the imager. If tissue attenuation was 100-fold, this would yield a fluorescence intensity of 18 × 103 counts per second from the SLN, which based on Poison statistics, yields a counting error of less than 1%.
References
1. Mujumdar RB, Ernst LA, Mujumdar SR, Lewis CJ, Waggoner AS. Cyanine dye labeling reagents: sulfoindocyanine succinimidyl esters. Bioconjug Chem 1993;4(2):105-111.
2. Vera DR, Hall DJ, Hoh CK, Gallant P, McIntosh LM, Mattrey RF. Cy5.5-DTPA-galactosyl-dextran: a fluorescent probe for in vivo measurement of receptor biochemistry. Nucl Med Biol 2005;32(7):687-693.
3. Dubois M, Gilles KA, Hamilton JK, Rebers PA, Smith J. Colorimetric method for determination of sugars and related substances. Anal Chem 1956;28(3):350–356.
4. Hoh CK, Wallace AM, Vera DR. Preclinical studies of [(99m)Tc]DTPA-mannosyl-dextran. Nucl Med Biol 2003;30(5):457-464.
5. Diment S, Leech MS, Stahl PD. Generation of macrophage variants with 5-azacytidine: selection for mannose receptor expression. J Leukoc Biol 1987;42(5):485–490.
6. Stahl PD, Schlesinger PH, Sigardson E, Rodman JS, Lee YC. Receptor-mediated pinocytosis of mannose glycoconjugates by macrophages: characterization and evidence for receptor recycling. Cell 1980;19(1):207-215.
7. Leong SP, Kim J, Ross MI, et al. A phase 2 study of (99m)Tc-tilmanocept in the detection of sentinel lymph nodes in melanoma and breast cancer. Ann Surg Oncol 2011;18(4):961-969.
8. Beard P. Biomedical photoacoustic imaging. Interface Focus 2011;1(4):602-631.
9. Cope M, Delpy DT. System for long-term measurement of cerebral blood and tissue oxygenation on newborn infants by near infra-red transillumination. Med Biol Eng Comput 1988;26(3):289-294.
10. Gioux S, Choi HS, Frangioni JV. Image-guided surgery using invisible near-infrared light: fundamentals of clinical translation. Mol Imaging 2010;9(5):237-255.
Table E1. Binding Assay Results with Macrophage Clones J477E

Note.—Starting values were set automatically with LIGAND software. Mean equilibrium dissociation constant and fraction of nonspecific binding were 0.424 ± 0.310 (standard deviation) and 0.090 ± 0.022, respectively, for tilmanocept and 0.254 ± 0.098 and 0.083 ± 0.051, respectively, for Cy7 tilmanocept. P values for equilibrium dissociation constant and fraction of nonspecific binding were .28 and .79, respectively.


