Files in this Data Supplement:
Table S1. Putative taperin interaction partners. List of the top hits in the nuclear ECFP-taperin quantitative interactome screen, including the specific peptides identified for each and their respective heavy: light amino acid ratios. These ratios indicate the degree of enrichment above the background contamination due to non-specific binding of proteins to the affinity matrix (observed as a peptide ratio of 1:1 due to equal binding in the control and taperin IP). The asterisks (*) indicate where specific PP1 isoform peptides were identified (the remaining PP1 peptides are common to all 3 mammalian isoforms).
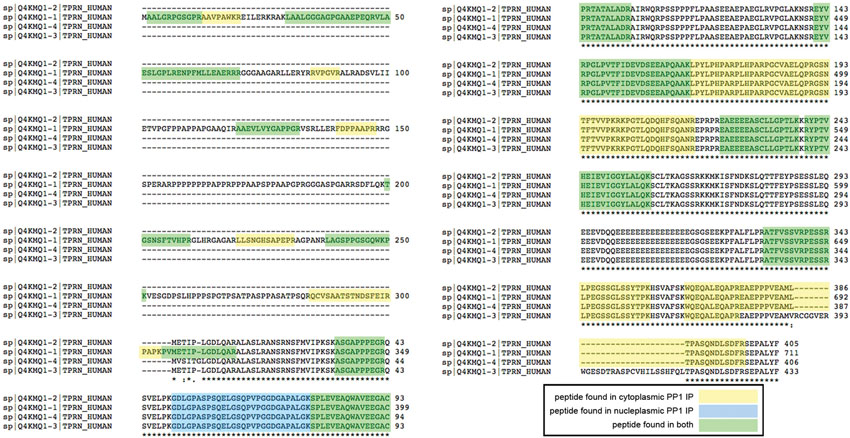
Fig. S1. Peptide coverage for taperin in PP1 interactome screens. A ClustalW alignment of the 4 predicted human taperin isoforms is shown here, with the peptides detected in the quantitative mass spectrometry-based PP1 interactome screens highlighted in gray. These peptides span the entire length of isoform 1 of taperin. No specific isoform 3 or 4 peptides were detected. As isoform 2 is identical to the C-terminus of isoform 1, it is not possible to determine if any isoform 2-specific peptides were identified.
Fig. S2. 6His-taperin expression and purification. (A) Colloidal-Coomassie stained 10% SDS-PAGE showing the purity of 6His-taperin (c9orf75) after Mono-S chromatography. Both bands of the major doublet band at ∼43kDa were confirmed to be taperin by mass spectrometry (data not shown). Minor bands labeled 1–5 on the left hand side were also identified by mass spectrometry, and are as follows: 1- E. coli UDP-L-Ara4N-formyltransferase/UDP-GlcA C-4′-decarboxylase, 2- taperin, 3- taperin, 4- no significant hit, 5- taperin (data not shown). (B) Taperin with its PP1 binding motif mutated (KASA) was expressed in bacteria and purified as for the WT protein. Molecular weight markers are shown on the right.
Fig. S3. Characterization of the affinity purified taperin antibody. The specificity and sensitivity of the polyclonal affinity purified taperin antibody in Western blot analysis was demonstrated by comparing it to purified IgG from the pre-immune serum. Compared to an equivalent amount of pre-immune IgG (A), the affinity purified taperin antibody specifically recognizes both recombinant, purified taperin (B, left-hand side) and endogenous taperin in crude HeLa lysates (B, right-hand side). Total amount of purified protein and crude lysate loaded are noted at the top of each lane. The purified antibodies (IgG or anti-taperin) were used at a concentration of 1 µg/mL, anti-rabbit secondary antibodies at a 5000-fold dilution and signals detected by ECL. Both Western blots were performed in parallel to allow a direct comparison. Molecular weight markers are shown on the right. As a control for the anti-taperin immunofluorescence experiment shown in Fig. 2, PFA-fixed and permeabilized HeLa cells were stained with an equivalent concentration of purified IgG from pre-immune serum and anti-rabbit Dylight-488 secondary antibodies (C, green). Cells were counter-stained with Hoechst 33342 to label DNA (D, red), and the images merged (E). No appreciable cellular signal was detected. Scale bars are 10 µm.
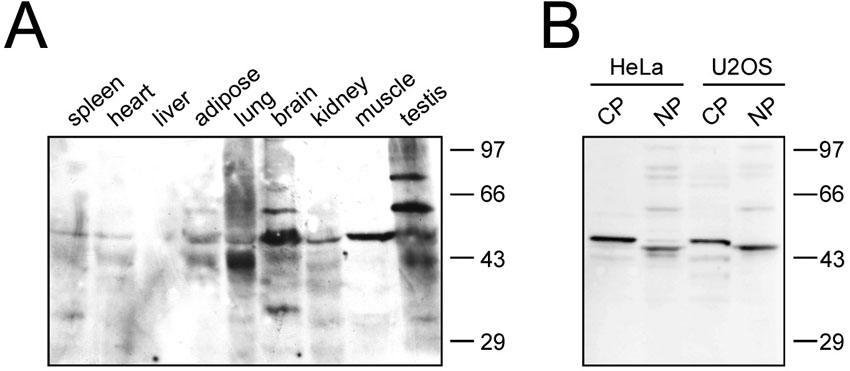
Fig. S4. Taperin is expressed as multiple isoforms in various tissues and exits the nucleus during cell fractionation. Various rat tissue crude extracts as indicated (A) were prepared and 45 µg of each separated by 10% SDS-PAGE, transferred to nitrocellulose and probed for taperin using affinity-purified antibodies. In (B), cytoplasmic (CP) and nucleoplasmic (NP) fractions were prepared from HeLa and U2OS cells and probed for taperin by Western blotting. Molecular weight markers are shown on the right hand side.
Fig. S5. Annotation of taperin and phostensin in the spatial interactomes of PP1α and PP1γ. Enrichment and relative abundance of taperin and phostensin in pulldowns of GFP-tagged PP1 isoforms stably expressed in HeLa cells. Data were extracted from quantitative mass spectrometric-based interactome screens based on differential labeling of HeLaEGFP-PP1α, HeLaEGFP-PP1γ cells and parental HeLa cells. Average log SILAC (heavy: light labeling) ratios were calculated for each protein and plotted versus summed peptide intensities normalized for molecular weight. This demonstrates both the degree of enrichment of each protein in the PP1 IP vs. the control IP and its relative abundance as detected by mass spectrometry. The number of unique peptides identified for each protein in cytoplasmic (CP) or nucleoplasmic (NP) IPs is indicated in parentheses.
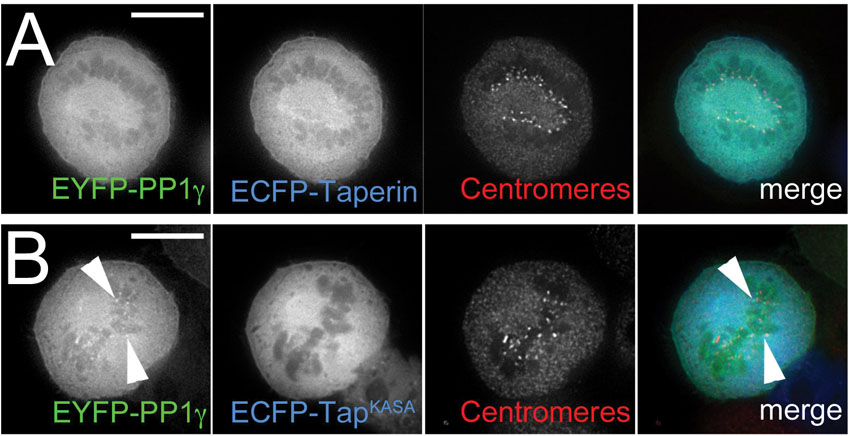
Fig. S6. Taperin can relocalize PP1 in mitotic cells. (A) The characteristic localization patterns of mitotic PP1γ are also disrupted by over-expression of taperin, as demonstrated here in a metaphase cell. When co-transfected, EYFP-taperin (green) prevents the kinetochore localization of ECFP-PP1γ (blue). Centromeres, which lie adjacent to kinetochores, are labeled here by immunofluorescence with anti-CENP antibodies (red). (B) Co-expression of the non-PP1 binding mutant EYFP-taperinKASA with ECFP-PP1γ does not prevent the kinetochore targeting of PP1 in metaphase cells. Scale bars are 5 µm.
Fig. S7. Sequence relationship between phostensin and taperin. Human phostensin (isoform 1, 613 amino acids) and taperin (isoform 1, 711 amino acids) amino acid sequences were aligned to illustrate the limited, but significant conservation over the full-length and the high degree of homology in the sequence surrounding the PP1 binding site (KISF, underlined in red). Putative ‘RGG’ RNA binding domains are highlighted in yellow. Numbers refer to amino acid position.
Fig. S8. Taperin is found in the genomes of vertebrates only. Human taperin (isoform 2) and phostensin (isoform 1) amino acid sequences were used in pBLAST and tBLASTn searches to identify and collect related sequences. Orthologues were aligned in ClustalW and Genedoc and the most conserved region (surrounding the RVxF motif) was used to build a NJ tree. Both taperin and phostensin contain no known domains and are only present in the genomes of vertebrate species.
Fig. S9. Dotplot analysis of phostensin and taperin. Dotplot analysis was performed for full-length human phostensin (isoform 1, 613 amino acids; A), human taperin (isoform 1, 711 amino acids; B), and human taperin versus human phostensin (C).
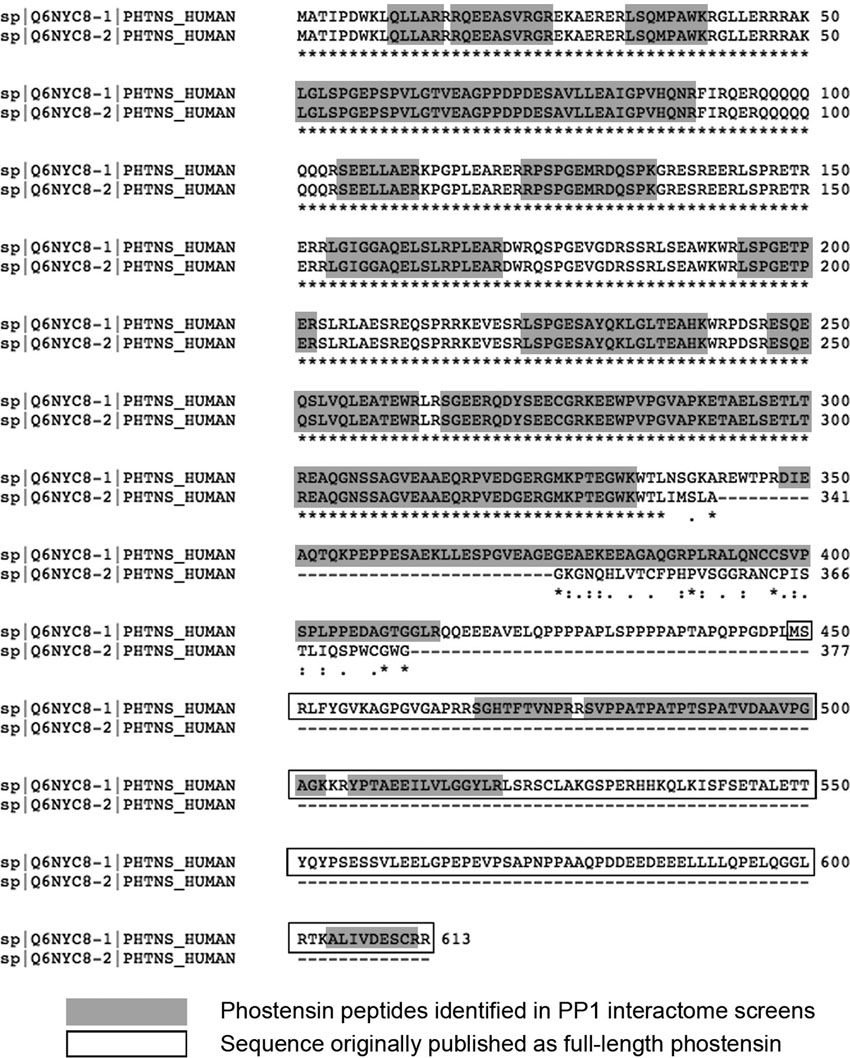
Fig. S10. Peptide coverage for phostensin in PP1 interactome screens. A ClustalW alignment of the 2 predicted human phostensin isoforms is shown here, with the peptides detected in the quantitative mass spectrometry-based PP1 interactome screens highlighted in gray. These peptides span the entire length of isoform 1, and no specific isoform 2 peptides were detected. The box indicates the C-terminal fragment of isoform 1 originally published to be full-length phostensin. It is not known whether this represents a third phostensin isoform.
Fig. S11. Phostensin is enriched at the cell periphery and localizes with actin filaments. HeLa cells were co-transfected with GFP-phostensin (green) and mCherry-actin (red) to demonstrate the co-localization of full-length phostensin (isoform 1) with actin filaments in stress fibers (arrowhead) and at the cell periphery (arrow). Scale bars are 5 µm.
Fig. S12. Characterization of isoform-specific antibodies for human PP1 α, β and γ. (A) To validate the specificity of the PP1 antibodies, the PP1 α, β and γ peptides used as antigen and an unrelated 10 amino acid peptide (negative control) were spotted as shown to a nitrocellulose membrane and probed with each affinity-purified antibody. (B) Two amounts of a HeLa crude lysate (1 and 5 µg) and recombinant, purified human PP1α, β and γ (1 to 50 ng) were separated by SDS-PAGE, transferred to nitrocellulose and probed with affinity-pure PP1 α, β and γ antibody as indicated. Both PP1β and γ antibodies were specific for their respective antigens and detected a single protein of the correct mass in a HeLa cell crude lysate. It was noted that the PP1α antibody could weakly detect PP1β (B, top panel); however, this signal is abrogated by pre-blocking the antibody with the PP1β−peptide (see supplementary material Fig. S13).
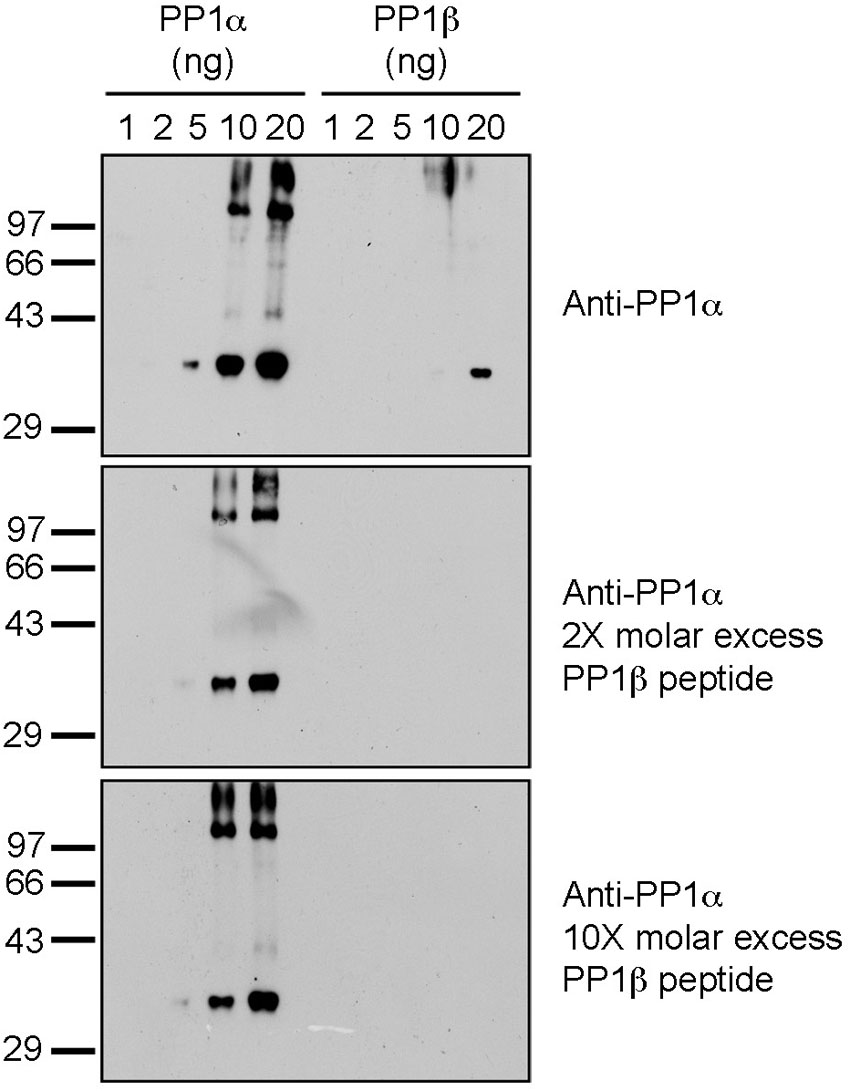
Fig. S13. Validation of PP1α isoform-specific antibody. Recombinant, purified human PP1α and β (1 to 20 ng) were separated by SDS-PAGE, transferred to nitrocellulose membrane and probed with 1 µg/mL affinity-pure PP1α antibody alone (upper panel) or with a 2- or 10-fold molar excess of the PP1β peptide (SEKKAKYQYGGLNSGR), as indicated in the lower panels. This method blocks antibodies that have the ability to bind PP1β and makes the antibody working solution PP1α-specific.