Files in this Data Supplement:
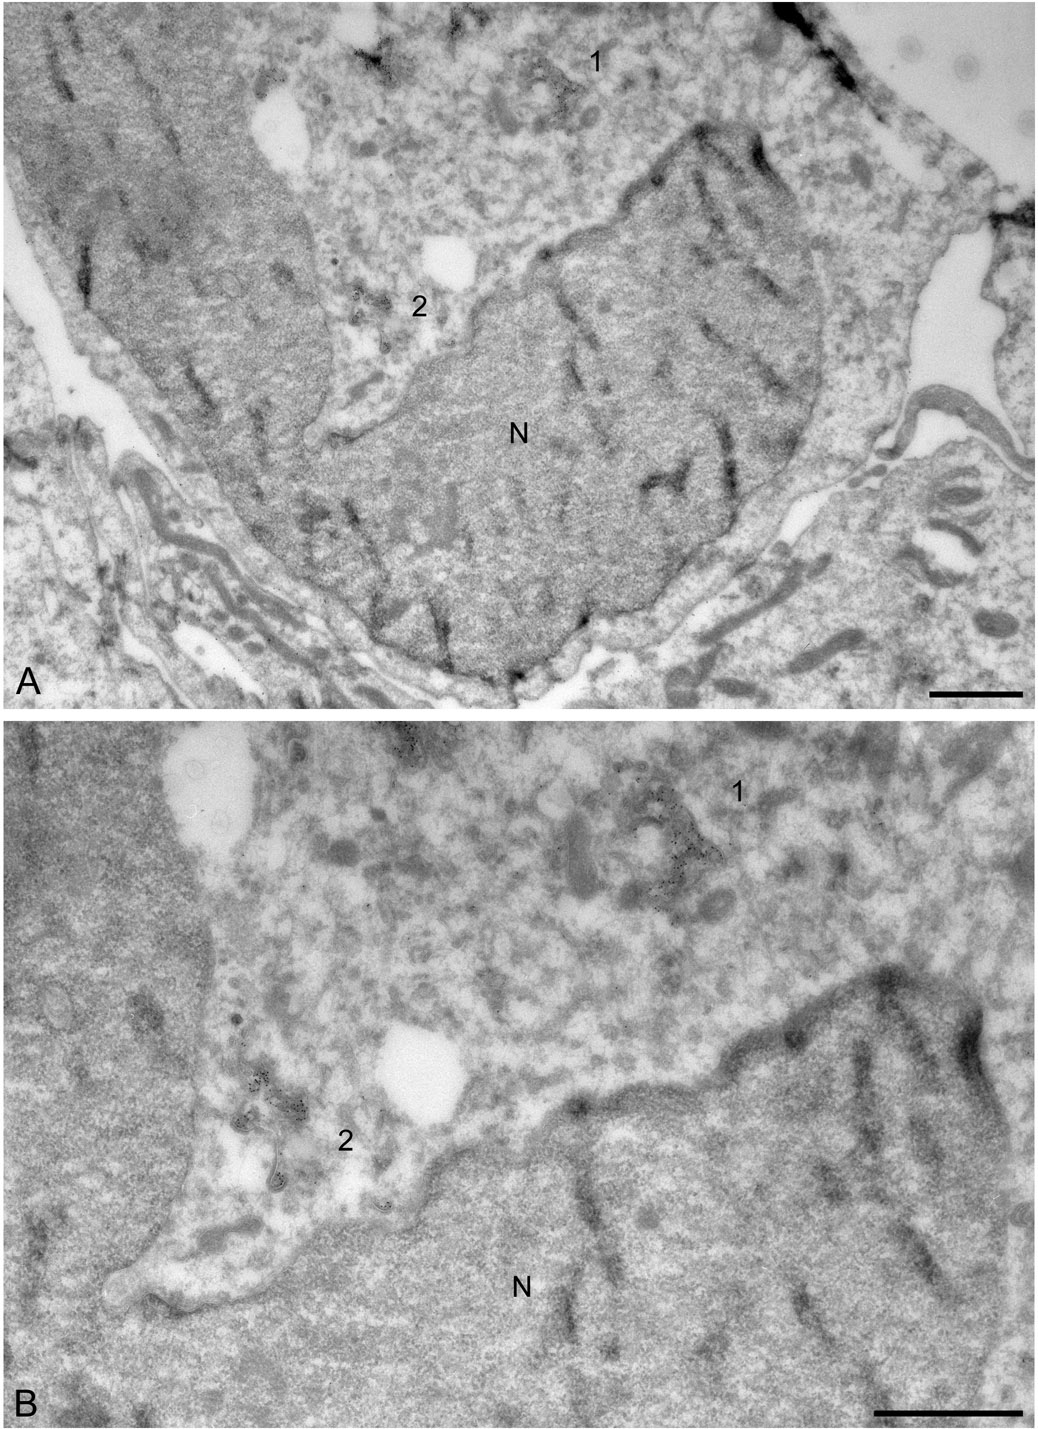
Fig. S1. Low magnification electron micrographs of the cell shown in Fig. 1A–C to facilitate correlation of the light and electron microscopy figures. Endosomes 1 and 2 correlate to the endosomes shown in Fig. 3. N = nucleus. Bars, 1 µm.
Fig. S2. Endosomal localization of internalized GH-biotin in control U2OS cells. After 30 min GH-biotin uptake cells were processed for ultrathin cryosectioning and labeled with anti-biotin and PAG10. (A,B) Internalized GH-biotin is seen in dispersed endosomal vacuoles (E) that can display a prominent clathrin coat (arrows). The plasma membrane (P) is only sparsely labeled, N, nucleus. Bars, 200 nm.
Fig. S3. Effect of Triad1 depletion on GH uptake and receptor accumulation. (A) Nuclear and cytoplasmic localization of endogenous Triad1. Endogenous Triad1 was stained in U2OS cells with a primary antibody against Triad1 and a Texas-Red labeled secondary antibody. Cells showed both nuclear and cytoplasmic localization of Triad1. Several cells showed perinuclear Triad1 staining. DAPI staining was included to stain the nucleus. The specificity of the Triad1 antibody has been demonstrated previously ( Marteijn et al., 2007; Marteijn et al., 2009). (B) Time course of si-Triad1 depletion. U2OS cells expressing GHR were depleted for Triad1 for the time periods indicated and incubated with cy3-GH (red) for 30 min and chased for 30 min in presence of Alexa-488 Tf (green). Control cells were treated with control si-RNA. (C) Effect of Triad1 depletion on GH and fluid phase uptake. U2OS cells expressing GHR were depleted for Triad1 for 3 days, Cells were incubated with 647-dextran (green) for 2 h. During the last 30 min cy3-GH (red) was added. Control cells were treated with control si-RNA. (D) Effect of Triad1 and TrCP depletion on GH receptor accumulation at the plasma membrane and intracellularly. To compare quantitation of cy3-GH surface staining and 125I-GH binding data, U2OS cells from Fig. 2D were incubated with cy3-GH (red) and Alexa-488 Tf (green) for 30 min. As can be observed from this confocal image, phenotypes for Triad1 and TrCP were visible in about 50% of the cells.