Supplemental Data
Files in this Data Supplement:
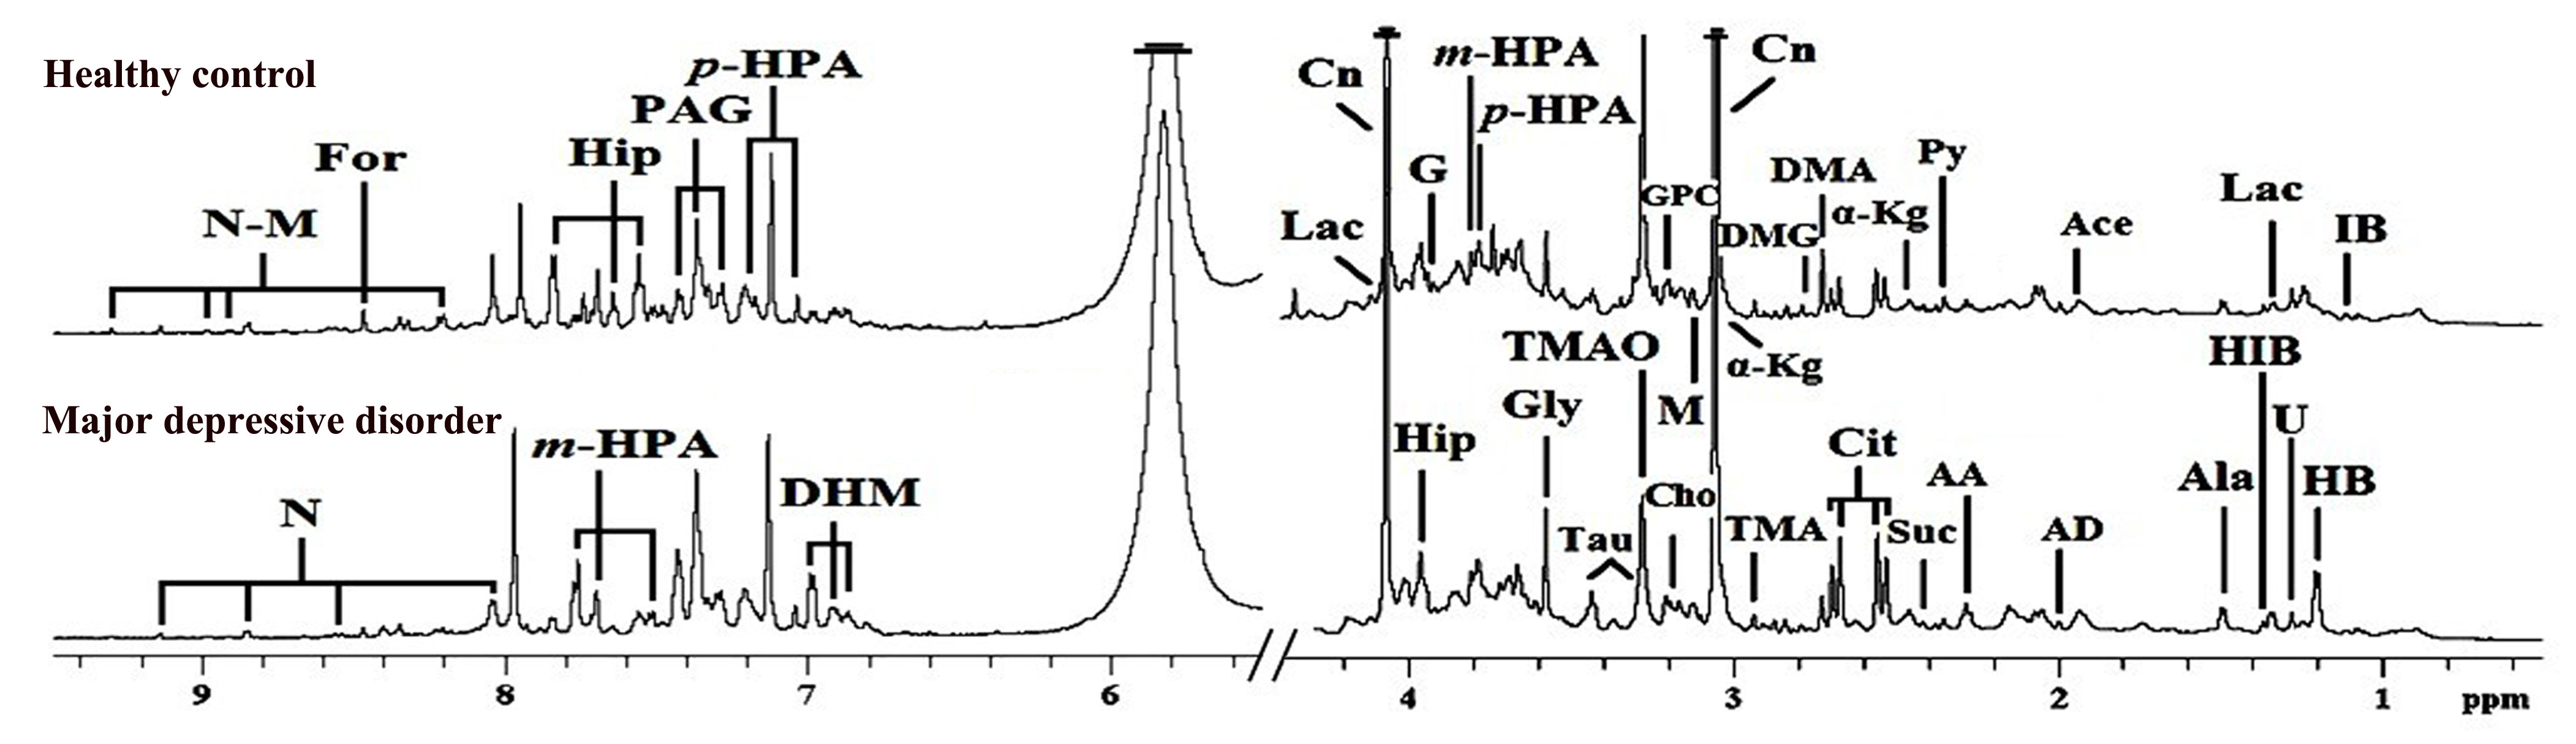
- Supplementary Figure 1 - Supplementary Figure 1.Representative 600 1H NMR spectra of urine obtained from a MDD subject and a healthy control
- Supplemental Table 1 - Supplemental Table 1.Individual demographic and clinical data of the recruited subjects
- Supplemental Table 2 - Supplemental Table 2.The relative concentration of these 23 metabolites responsible for discriminating between MDD subjects and healthy control
- Supplemental Table 3 - Supplemental Table 3.The non-differential metabolites between the MDD and healthy control groups
- Supplemental Table 4 - Supplemental Table 4. The relative concentration of non-differential metabolites between the MDD and healthy control groups