
Fig 5.
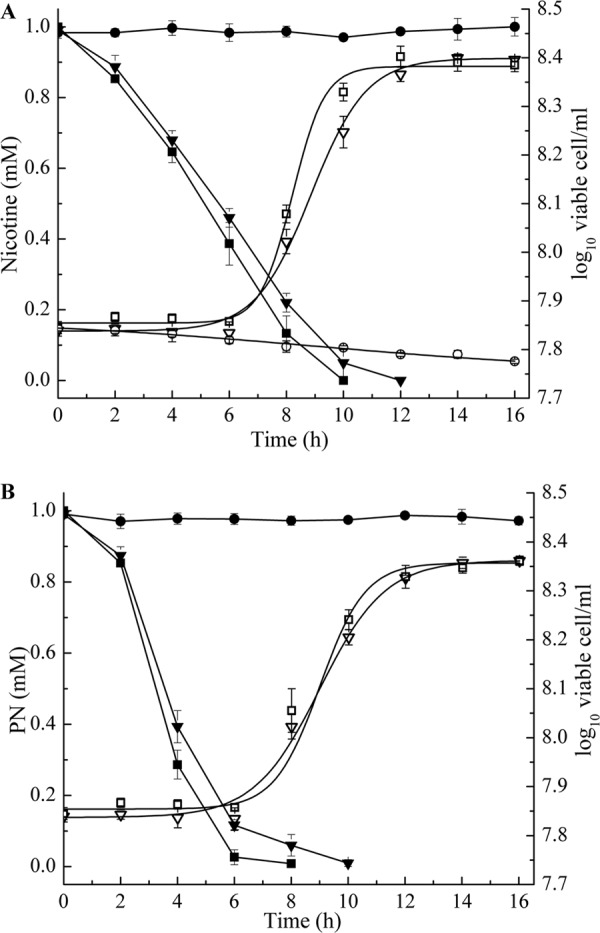
Time course of nicotine and PN degradation and cell growth in cultures of strain HZN6 and its derivatives. (A) Left axis, nicotine concentrations in strains HZN6 (■), N6Δnox (●), and N6ΔnoxC (▼). Right axis, cell growth of strains HZN6 (□), N6Δnox (○), and N6ΔnoxC (▽). (B) Left axis, PN concentrations in strains N6Δnox (■), N6ΔnoxC (▼), and an uninoculated control (●). Right axis, cell growth of strains N6Δnox (□) and N6ΔnoxC (▽). The error bars represent the standard deviations of three replicates.