Human Renovascular Disease: Estimating Fractional Tissue Hypoxia to Analyze Blood Oxygen Level–dependent MR
© RSNA, 2013
Appendix E1
Background
Experimental studies indicate that reductions in blood flow that lead to cortical and medullary ischemia produce corresponding changes in both cortical and medullary R2* under acute conditions lasting from 15 minutes to 2 hours (19,29). Maneuvers that reduce oxygen consumption, such as furosemide administration, which inhibits sodium reabsorption at the medullary thick ascending limb of the loop of Henle, lower primarily medullary R2* levels, consistent with reduced local oxygen consumption and a lower local concentration of deoxyhemoglobin (11). Altering sodium intake also changes the degree of energy consumption associated with tubular solute exchange (30).
Materials and Methods
Blood pressure measurements were obtained. On the 1st day, blood pressure was measured by using automated oscillometric recordings, including three values obtained three times daily with an automated oscillometric unit in the Clinical Research Unit, St Mary’s Hospital (Rochester, Minn) (model Hem-907XL; Omron, Kyoto, Japan). Blood pressure was measured at 5, 7, and 9 minutes after a 5-minute rest.
Multidetector CT
On the 3rd day of the study, the common femoral vein was cannulated with a 6-F sheath, and blood samples were drawn from the right and left renal veins with a 5-F pigtail Cobra catheter (Cook, Bloomington, Ind) for venous oxygen and plasma renin activity. The catheter was then advanced into the right atrium for central venous injection of contrast agent for transit time studies by using multidetector CT. Multidetector CT was performed by using a dual-source 64-section helical multidetector CT scanner (Somatom Definition; Siemens Medical Solutions, Malvern, Pa) after a bolus injection of iohexol 350 (Omnipaque 350; GE Healthcare, Waukesha, Wis), 0.5 mL/kg up to a maximum of 40 mL, by using a power injector (Liebel-Flarsheim Illumena CT; Mallinckrodt, Hazelwood, Mo) during respiratory suspension. Perfusion scans were obtained at 120 kVp and 160 mAs (adjusted per level of signal-to-noise ratio of the scan), with 20 × 1.2 collimation and zero table feed. The flow study was composed of 35 scans divided into three consecutive scanning sequences (each 20 seconds long), followed by 10 additional scans at 8-second intervals, for a total of 45 scans. The total scanning time lasted approximately 158 seconds. The longest breath hold was 20 seconds. Images representing the four sections (5-mm thickness) localized in the hilum region were acquired and reconstructed by using a B40f kernel. Fifteen minutes after completion of the perfusion study, a kidney volume study (5-mm-thick sections) was performed to determine both cortical and medullary regional volumes.
CT Data Analysis
Multidetector CT images were reconstructed and displayed with a software package (Analyze; Biomedical Imaging Resource, Mayo Clinic, Rochester, Minn). ROIs were selected from cross-sectional images from the aorta, renal cortex, and medulla. The boundaries of the aorta, renal cortex, and the medulla were seen at peak opacification and were arbitrarily manually delineated and traced (31). Average tissue attenuation in each region (that covers most of the renal parenchyma, more than 70%) was plotted over time and fitted by curve-fitting algorithms to obtain measures of renal function, as described previously (21,22). Cortical and medullary volumes were calculated by using the software package (Analyze) and RBF as the sum of the products of cortical and medullary perfusions and corresponding volumes.
References
29. Juillard L, Lerman LO, Kruger DG, et al. Blood oxygen level-dependent measurement of acute intra-renal ischemia. Kidney Int 2004;65(3):944-950.
30. Textor SC, Gloviczki ML, Flessner MF, et al. Association of filtered sodium load with medullary volumes and medullary hypoxia in hypertensive African Americans as compared with whites. Am J Kidney Dis 2012;59(2):229-237.
31. Lerman LO, Rodriguez-Porcel M, Sheedy PF 2nd, Romero JC. Renal tubular dynamics in the intact canine kidney. Kidney Int 1996;50(4):1358-1362.
Supplemental Figures
 |  |
| Figure E1: A, Graph shows relationship between observer-selected medullary R2* (basal) and RBF (r = 0.098). B,Graph showsrelationship between observer-selected medullary R2* (basal) and single-kidney GFR (r = 0.02). | |
 |  |
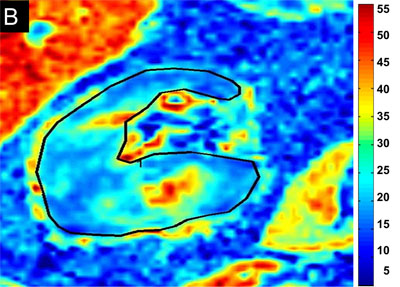
Figure E2: Examples of BOLD MR parametric maps for, A, a subject with EH and, B, a subject with atherosclerotic RAS obtained using the same color scale for R2*. Cortical R2* and medullary R2* measured by using the observer-selected small ROIs were similar in both kidneys, and the mean for EH cortex was 22 sec-1 versus 22.4 sec-1 for atherosclerotic RAS; the mean for the medulla was 32 sec-1 versus 32.6 sec-1, respectively; however, the fractional hypoxia in atherosclerotic RAS was far greater than in EH (28.5% vs 11.3%). | |
 |  |
 |  |
Figure E3: Parametric R2* maps from transverse axial sections all at the hilum for a single kidney from four different levels. These images demonstrate similar levels of cortical R2* (coefficient of variation was less than 7%) but widely varying estimates of fractional hypoxia (31%, 19%, 15%, and 41%, respectively). Taken together, average values remained above those for EH, but the variability of hypoxic zones emphasizes the sensitivity of all BOLD imaging to specific section selection. A, Mean of cortical R2*; B, Mean of fractional hypoxia; C, Mean cortical R2* after furosemide administration; and D, Mean of fractional hypoxia after furosemide administration. | |

Figure E4: Bland-Altman plots represent the agreement between the two operators. A and C, Plots show means of cortical R2* before and after furosemide administration, respectively. B and D, Plots show fractional hypoxia before and after furosemide administration, respectively. Data were obtained from both operators and were averaged; the difference is presented as a function of the mean. The bias (middle dashed line) is the mean of differences, the upper limit (top dashed line) is bias + 2 standard deviations, and the lower limit (bottom dashed line) is bias - 2 standard deviations.