Supplemental Data
Files in this Data Supplement:
- Supplemental figure 1 - Figure S1. Human ORFs used in this study and expected size (in aminoacids and kDa) of the corresponding proteins. Note that SNX6 is a truncated ORF that leads to a shorter protein. Truncation affects the PX domain but not the BAR domain.
- Supplemental figure 6 - Figure S6: Heterodimers identified in this study and their detection in the cell according to the literature.
- Supplemental figure 2 - Figure S2. AlphaScreen curves obtained for SNX8-SNX3 interaction in the different configurations. The interaction between SNX8 and SNX3 can only be observed with myc-tagged proteins. We believe this is due to steric hindrance when the monomer SNX3 binds to the curved SNX8 dimer, the GFP tag of SNX3 is not fully accessible whereas the myc moiety on the Cherry tag is still available for binding to the bead surface.
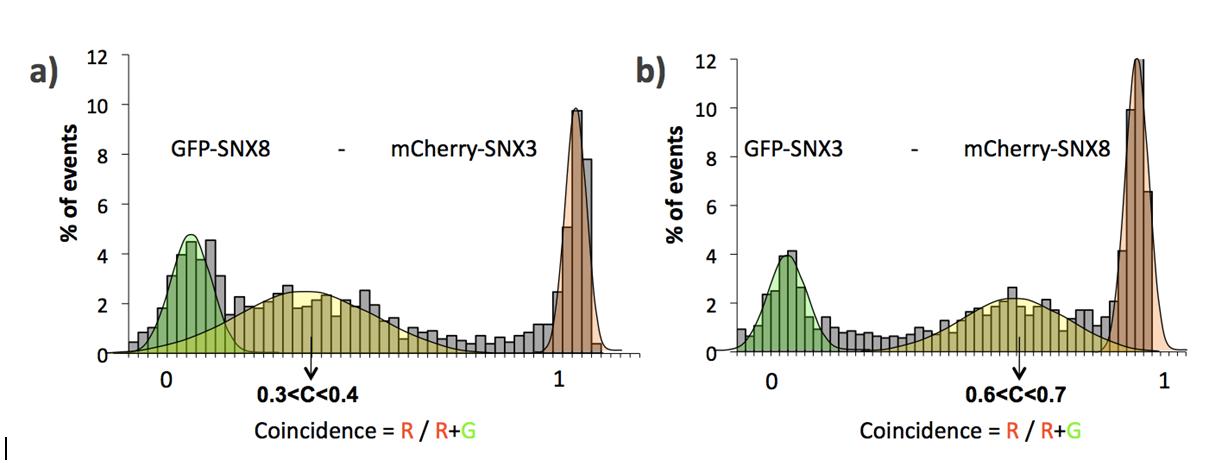
- Supplemental figure 3 - Figure S3. Single-molecule two-color coincidence obtained for SNX8-SNX3 pairs. As described in the text, the histograms suggest that SNX8 forms a dimer and that a monomer of SNX3 can bind to the SNX8 dimer. When we exchange the GFP and Cherry tags between the two proteins, the stoichiometry remains the same, 2:1 for SNX8 : SNX3.
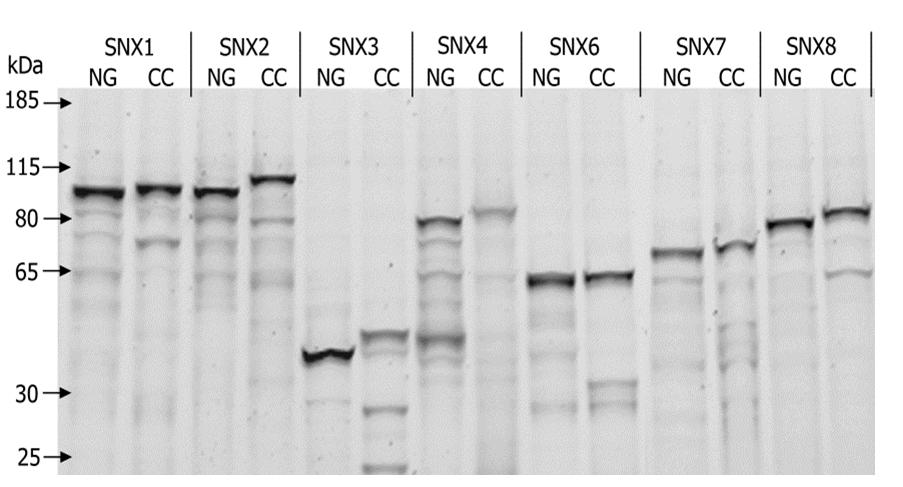
- Supplemental figure 4 - Figure S4. SDS-Page analysis of LTE expressed SNX-BAR domain proteins. The proteins were labelled with an unnatural amino-acid (bodipyFL-Lysine) during translation. Proteins were separated on SDS-PAGE gel (4-12% Tris-glycine) and visualised by in gel fluorescence scanning of the fluorescent Bodipy. As Bodipy incorporates randomly into proteins, the fluorescence is proportional to the expression levels.
- Supplemental figure 5 - Figure S5. Expression levels of the different proteins measured by GFP fluorescence. Serial dilutions of a well-characterized purified GFP protein were used to calibrate the conversion between fluorescence levels and protein concentration. This was then applied to measure the concentrations of the SNX proteins directly in the LTE.