
Extended Data Figure 2. Symmetry testing of Aegean Bronze Age populations.
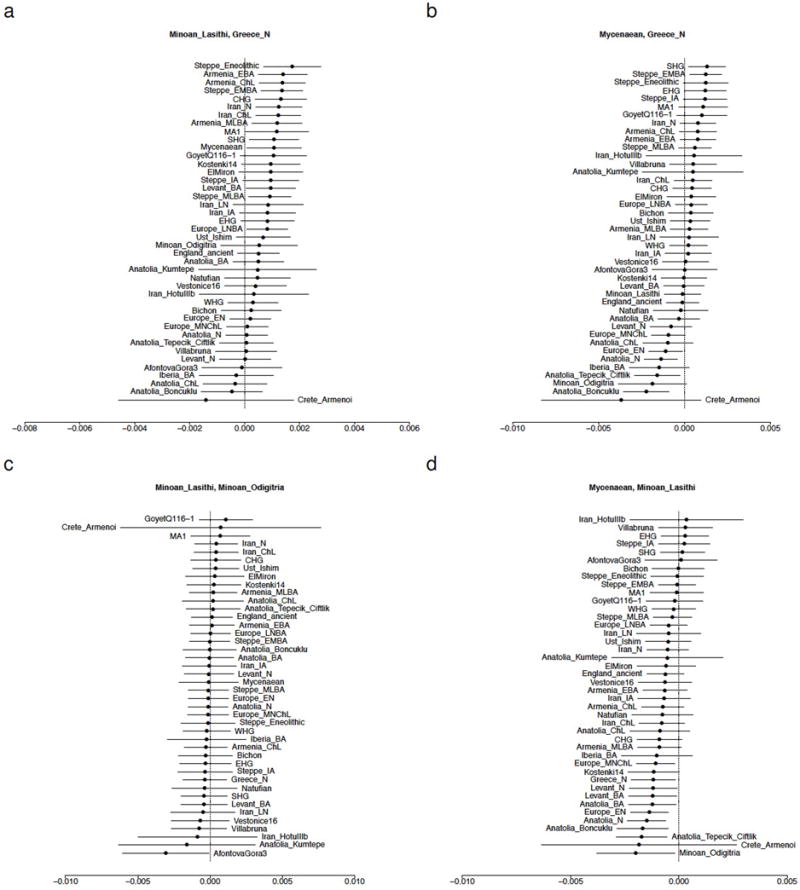
The statistic f4(X, Y; Test, Chimp) is shown with ±3 standard errors. Each panel is titled with the pair X, Y. Populations are ordered according to the value of the statistic. Positive values indicate that Test shares more alleles with X than Y and negative values that it shares more with Y than X. (a) ‘northern’ and ‘eastern’ populations share more alleles with Minoans than with Neolithic Greece. (b) ‘northern’ and ‘eastern’ populations share more alleles with Mycenaeans than with Neolithic Greece. (c) Minoans from Lasithi and Moni Odigitria are symmetrically related to diverse populations. (d) Neolithic populations from Anatolia, Europe, Greece, and the Levant share fewer alleles with Mycenaeans than with Minoans.