
Extended Data Figure 4. f3-statistics of Mycenaeans as a target with different pairs of reference populations.
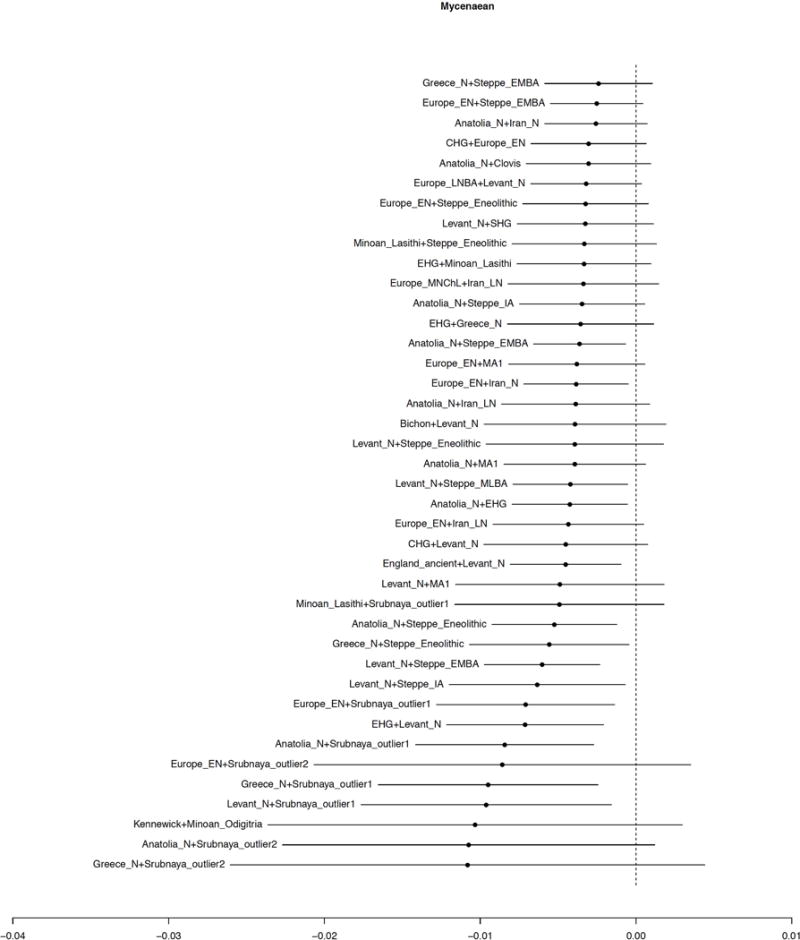
We show the value of the statistic f3(Ref1, Ref2; Mycenaean) and ±3 standard errors; only the population pairs (Ref1, Ref2) for which the Z-score of the statistic is <−2 are shown. Negative values indicate that the Mycenaean population is admixed from sources related to the two reference populations.