
Extended Data Figure 6. Comparison of Mycenaeans and simulated admixed populations.
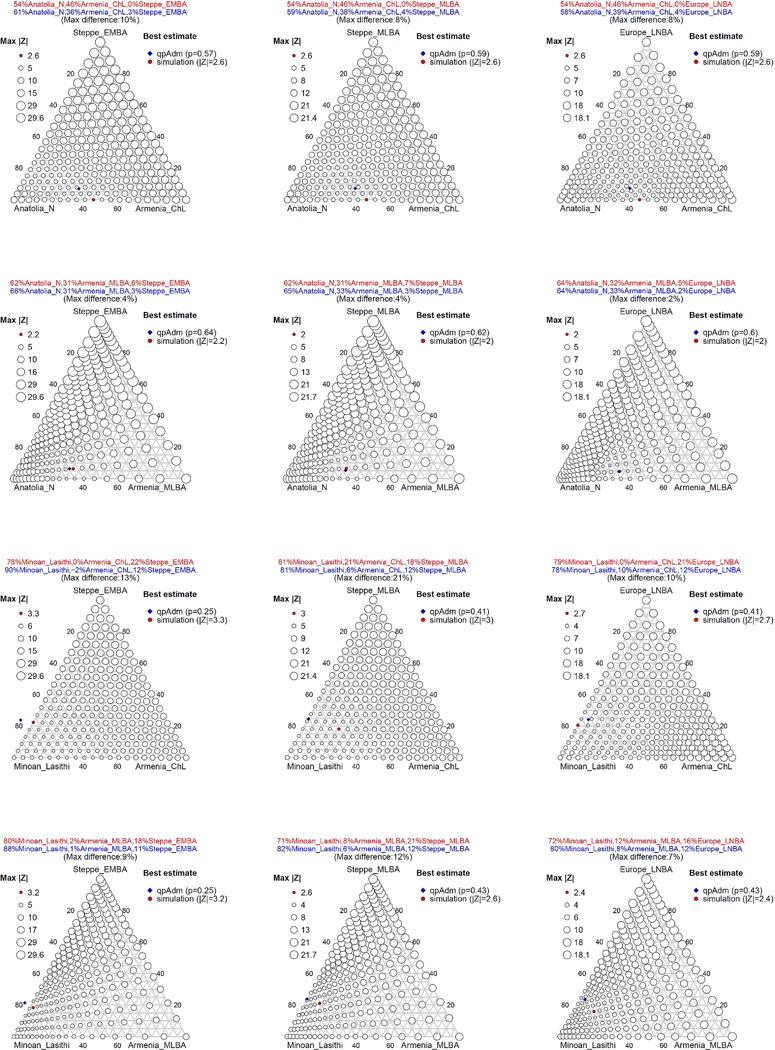
We simulate admixed individuals with known ancestry from three ancestral populations (Anatolia_N or Minoan_Lasithi), (Armenia_ChL or Armenia_MLBA), (Steppe_EMBA, Steppe_MLBA, Europe_LNBA), representing substratum, ‘eastern’, and ‘northern’ ancestry respectively (Methods; Supplementary Information, section 2). The maximum |Z|-score of statistics f4(Mycenaean, Simulated; Outgroup1, Outgroup2) is plotted with circles of varying size (proportional to log|Z|) for each assignment of ancestry proportions. The best estimate (red) corresponds to the proportions that minimize |Z|, and they are compared against the qpAdm estimate for the same ancestral sources (blue).