Oscillation in Counter-Phase and Multiple Potential Division Sites in Long Extended Filaments
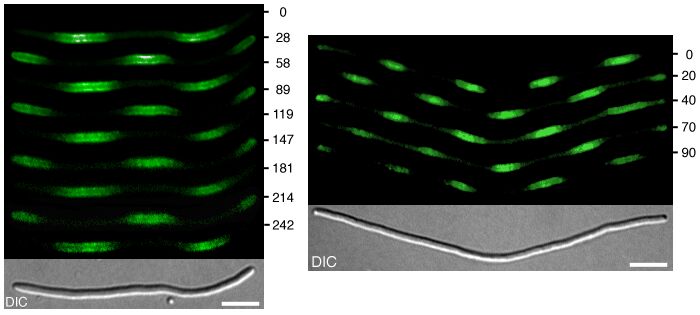
In filamentous cells, MinD (and associated MinC) dynamically accumulates onmultiple regularly spaced membrane segments along the length of the filaments, and these maxima oscillate in counter phase over time. As in wild-type cells, this dynamic behavior of MinC/D requires the presence of MinE. The figure below shows this behavior of Gfp-MinD in time-lapse fluorescence micrographs.

Time is indicated in seconds. The bottom panels show the filaments viewed with DIC optics. The bars represent 5 m m. Shown are cells of strain DR102(lDR122)/pDB346[DminCDE,ftsZ° (Plac::gfp-minD,minE)/PlR::ftsZ,cI857]. Cells were grown at 30° C (resulting in repression of ftsZ expression) in minimal medium supplemented with 37 mM isopropyl b -d-thiogalactoside. For additional details, see Raskin, D. M. & de Boer, P. A. J. (1999) J. Bacteriol. 181, 6419-6424 and Raskin, D. M. & de Boer, P. A. J. (1999) Proc. Natl. Acad. Sci. USA 96, 4971-4976. The corresponding dynamics of MinE in such filaments can be viewed
here.In the models, in a cell surpassing a critical size because of an inhibition of cell division, a transition occurs from one to two zones in which MinE sweeps back and forth. The positioning of the FtsZ pattern(s) follows the corresponding change in the distribution of MinD. The following simulation shows counter-phase oscillation in a medium-sized filament with two potential division sites.

![]()
The number of MinE waves that are present simultaneously equals the number of potential division sites, and this number increases with field size. FtsZ accumulates in the regions with the lowest time-averaged concentrations of MinD:

![]()