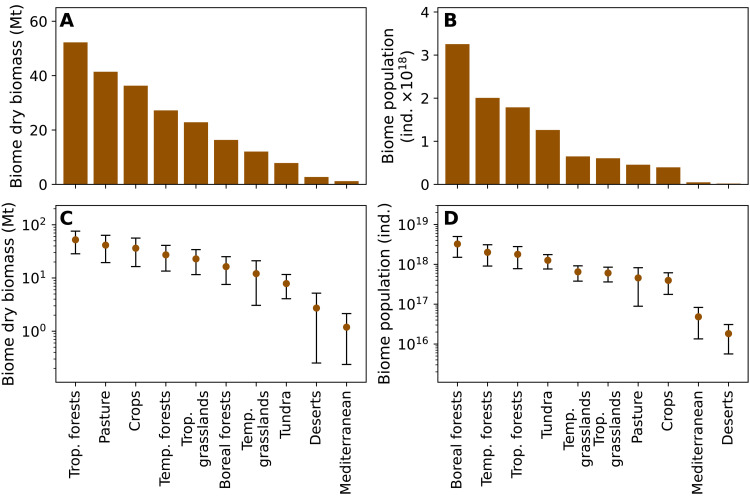
Fig. 3. Total biomass and number of individuals of soil arthropod across biomes.
For each biome, panels (A) and (C) show the total dry biomass on linear and logarithmic scales, respectively. Panels (B) and (D) show the same for total populations. Error bars represent 95% confidence intervals. Biomes are as in Fig. 2, with shortened names.

