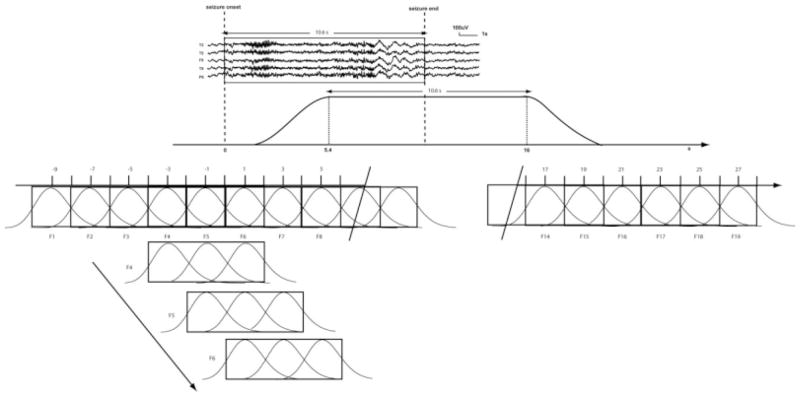
Figure 1.
Sliding windows analysis of the ictal discharge. On the scalp EEG, an expert indicated seizure onset and end. The peak of the expected hemodynamic response related to the seizure starts 5.4 s after the onset and finishes 5.4 s after the end of the discharge. Successive gamma function regressors having a full-width at half-maximum of 2 s and separated by 2 s were used as separate regressors from −9 s before the discharge onset until 10 s after the end of the expected hemodynamic effect of the electrical discharge (this end takes place 5.4 s after the end of the electrical discharge). The number of regressors applied in the general linear model analysis therefore depended on the duration of each seizure. All these regressors were merged in the same general linear model analysis (regressors for interictal events, motion, and drift were also included as confounds). Successive F-tests were applied on t-value results obtained for three consecutive 2 s models. Each F-test reflected results in a 6-s window. These windows overlapped by 4 s, providing a F-value every 2 s. The number of F-tests depended on the number of regressors used. The statistical threshold was corrected for the number of voxels and for the number of F-tests used for each patient.

