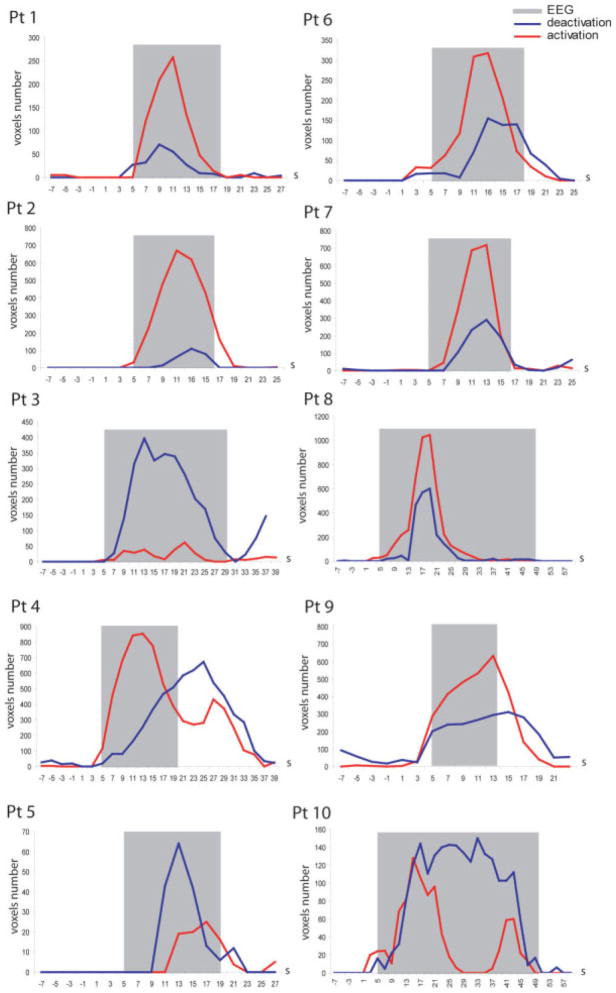
Figure 2.
Time course of the cerebral volume involved in BOLD changes. The total number of voxels located in the brain involved either in activation (red line) or deactivation (blue line) is measured during and around the epileptiform ictal discharge. The duration and timing of the hemodynamic response expected from the ictal EEG event appears in gray (the time and duration of the electrical changes were convolved with the standard HRF). The vertical scale is different for each patient to facilitate visual analysis.

