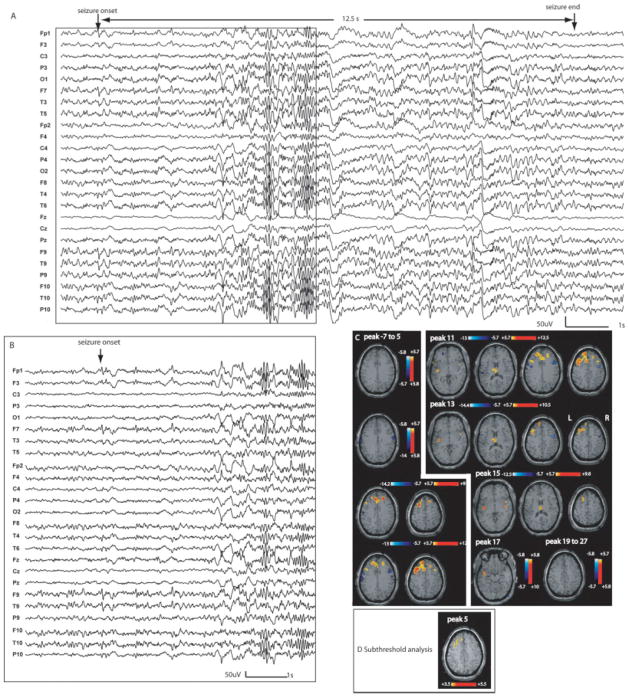
Figure 4.
Patient 1: A: Electrical seizure recording lasting 12.5 s during EEG-fMRI test. The ictal discharge started with left frontotemporal spiking activity observed in a referential montage (reference FCz) (left frontotemporal predominance more visible on average reference montage in B). C: The first significant activation started at peak 7 with early bifrontal involvement but left predominance. A secondary involvement of the thalami was observed (peaks 11, 13, and 15). The deactivation was located mostly near the onset area and the areas of propagation. D: After lowering the statistical threshold to 3.5, successive F-maps preceding the first significant activation map (peak 7) showed activation located in a similar area as the first significant activation. However, this early activation was much more focal over the left superior frontal gyrus and did not spread to the right.

