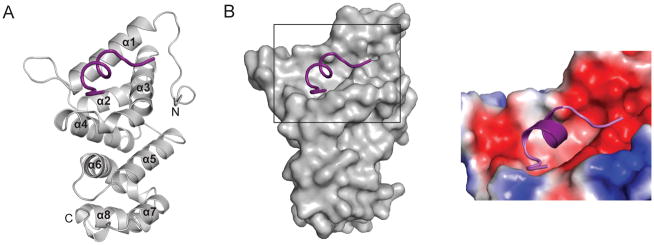
Figure 2.
Crystal structure of the TTP–CNOT1 complex. (A) Cartoon representation of the crystal structure of human CNOT1820–999 (grey) in complex with TTP peptide (purple). The eight CNOT1 helices are numbered starting from the N-terminus. (B) Left panel: Surface representation of CNOT1820–999. The bound TTP312–326 peptide (purple) is shown as a cartoon representation. Right panel: magnification of TTP binding site on CNOT1820–999 colored according to electrostatic potential, from dark red (−kT/e) to white (0 kT/e) to dark blue (+5 kT/e).

