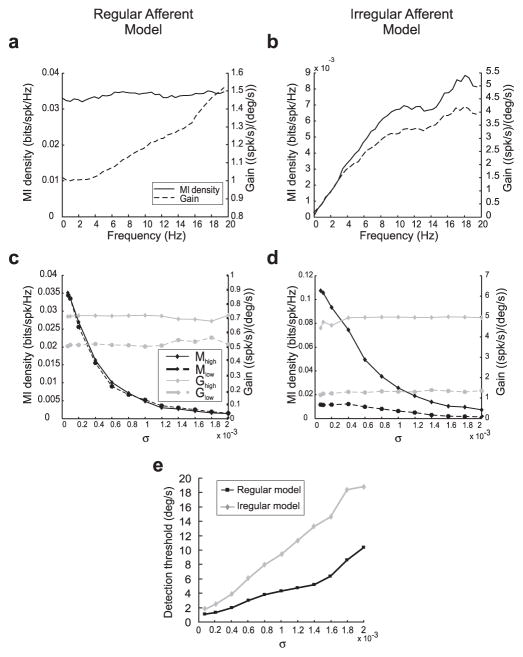
Figure 7.
The role of intrinsic noise on information processing and signal detection. a, Mutual information density (solid line) and gain curve (dotted line) obtained with the regular afferent model under driven conditions. The mutual information curve was constant over frequency, whereas the gain curve increased with frequency. b, Mutual information density (solid line) and gain curve (dotted line) obtained with the irregular afferent model under driven conditions. Both the mutual information density and the gain curve increased with frequency. c, Low-frequency (dotted black line) and high-frequency (solid black line) average mutual information densities as a function of noise intensity σfor the regular afferent model. Both quantities decreased as σ increased. In contrast, the low-frequency (dotted gray line) and high-frequency (solid gray line) averaged gains were unaffected by variations in σ. d, Low-frequency (dotted black line) and high-frequency (solid black line) average mutual information densities as a function of noise intensity σfor the irregular afferent model. Both quantities decreased as σ increased. In contrast, the low-frequency (dotted gray line) and high-frequency (solid gray line) averaged gains were unaffected by variations in σ. e, Detection threshold velocities of regular afferent model (black line) and irregular afferent model (gray line) as a function of noise intensity σ. The detection threshold increased with increasing noise intensity for both models.

