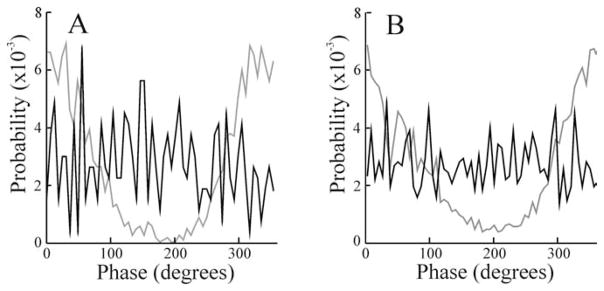
Figure 9.
A, Phase histograms summarizing the phase relationships between simulated superficial (black line) and deep (gray line) cells and the EOD waveform during local stimulation. B, Phase histograms for an actual superficial (black line) and deep (gray line) basilar pyramidal cell during local stimulation. Firing rates for these cells were 12.2 and 37.6 spikes/s, respectively.

